

Local dashboard
schemabrain dashboard boots a FastAPI sidecar on 127.0.0.1:7878 that serves a pre-built Next.js static export. The UI reads from the same SQLite store + mcp_audit table the MCP server writes to. No Node runtime, no network exposure, no write paths.- Which entities carry catastrophic-leak PII categories? — see PII matrix.
- What did SchemaBrain refuse, and what envelope did the agent receive? — see Refusals.
- Is the hash-chained audit log still intact? — see Audit Viewer.
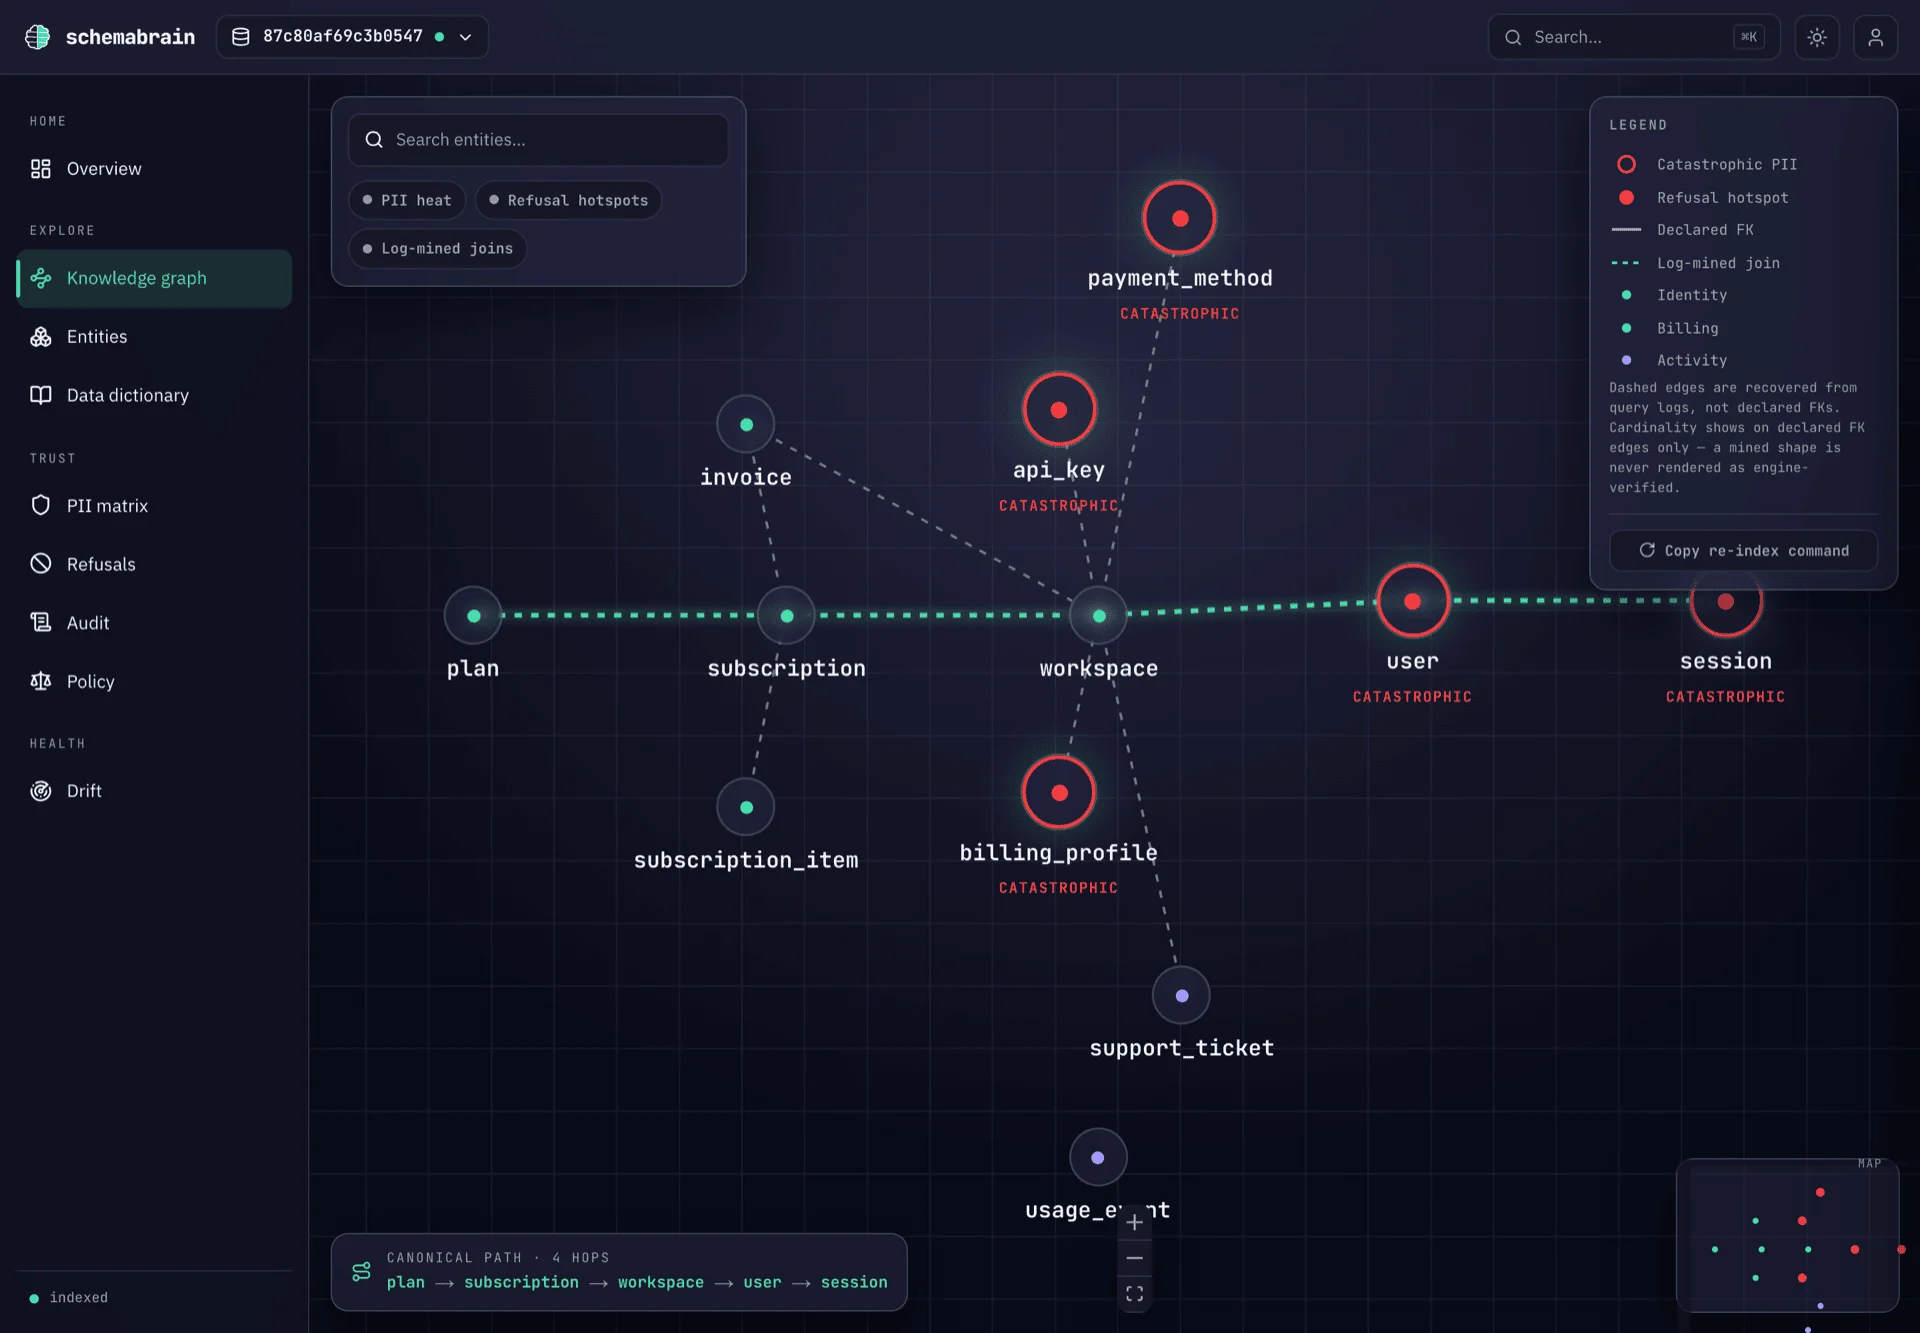
Knowledge Graph — entities as nodes, canonical joins as edges, catastrophic-PII entities flagged, and the compiled join path traced.
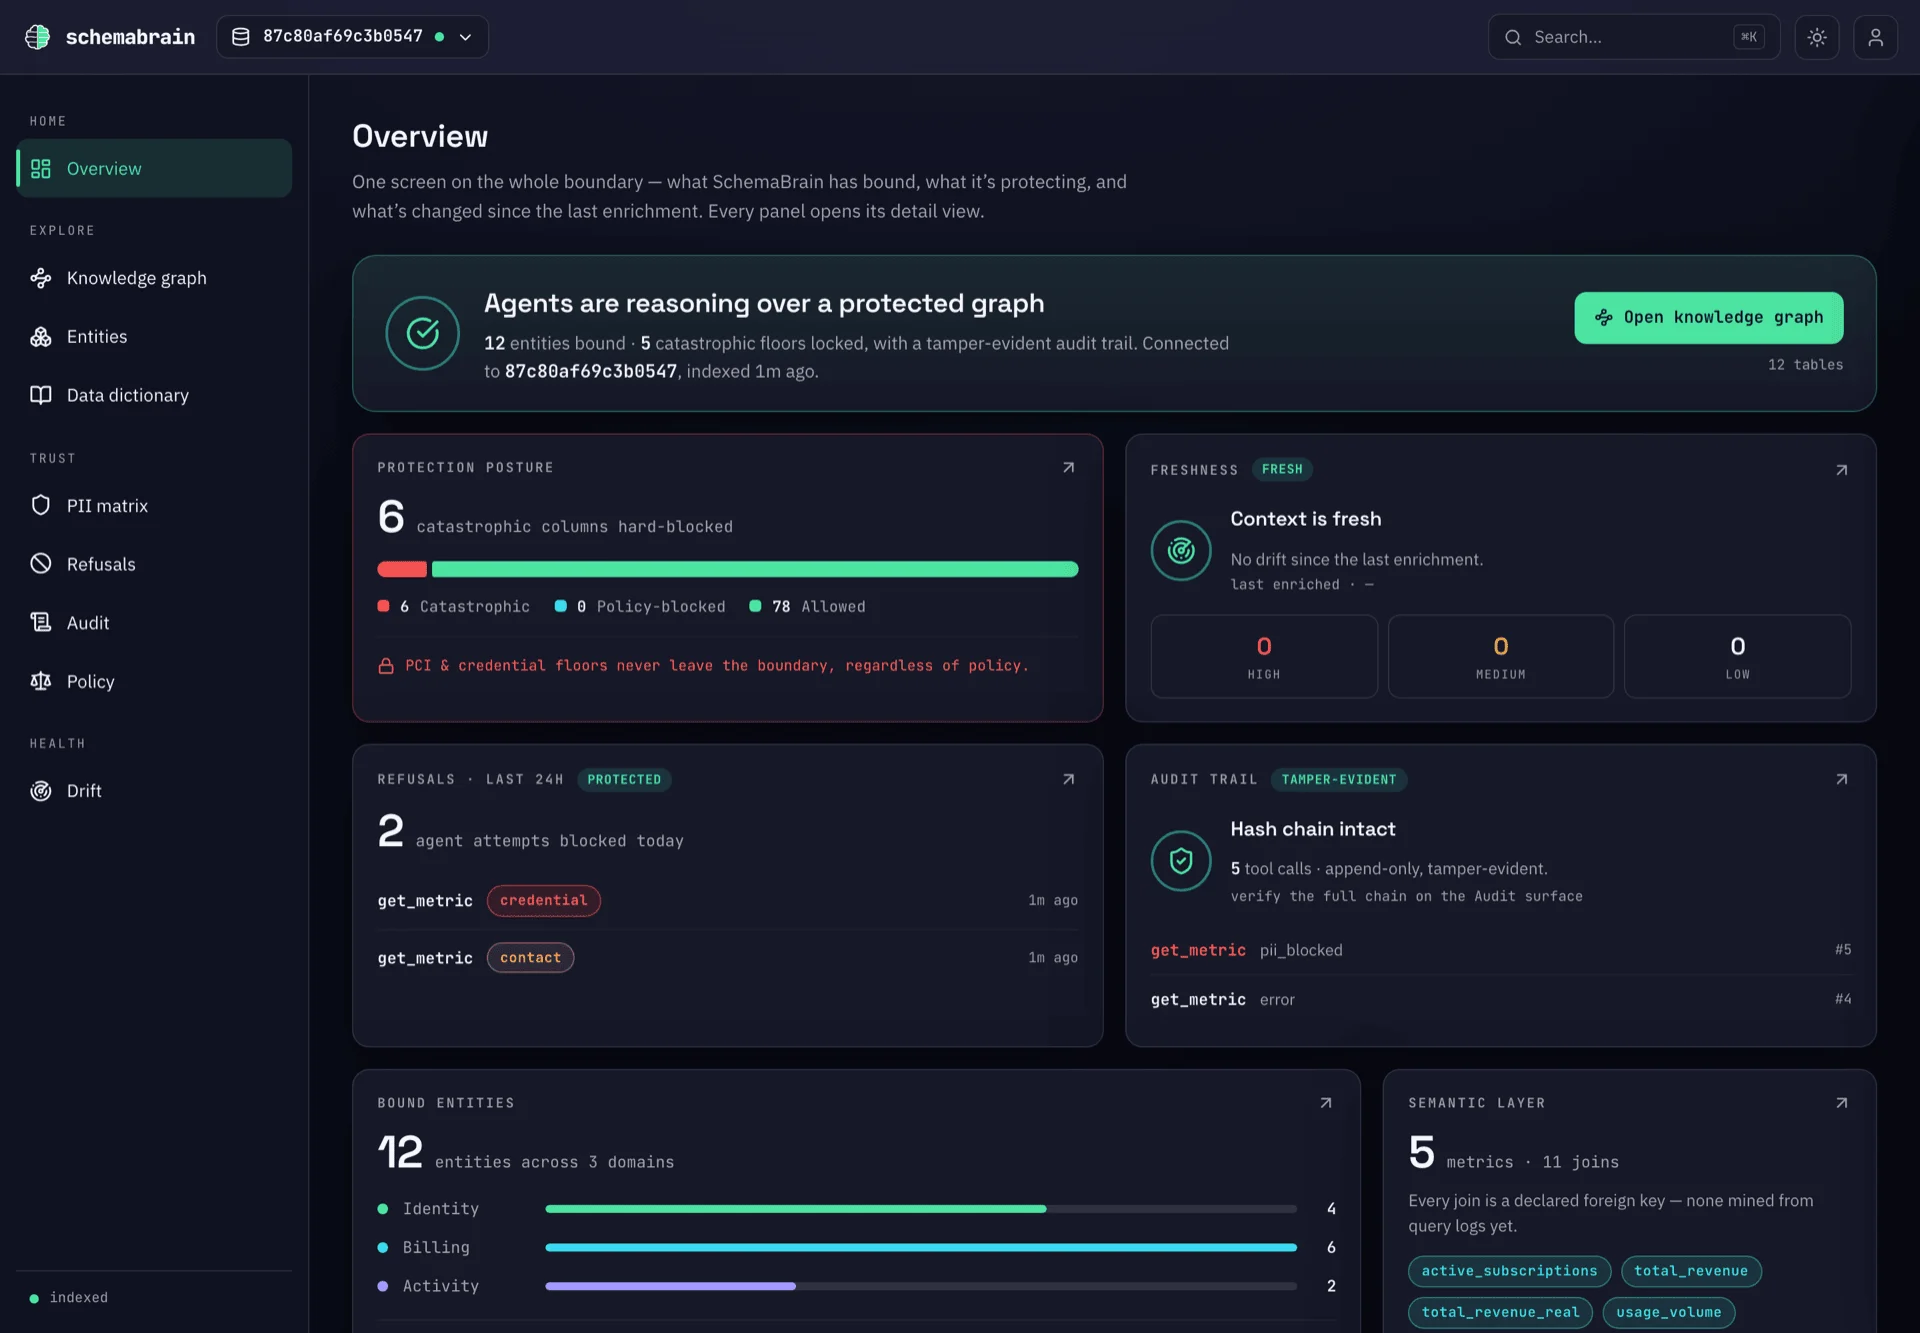
Overview — the whole boundary on one screen: bound entities, catastrophic-PII floors, refusals, and audit-chain health, each panel opening its detail view.
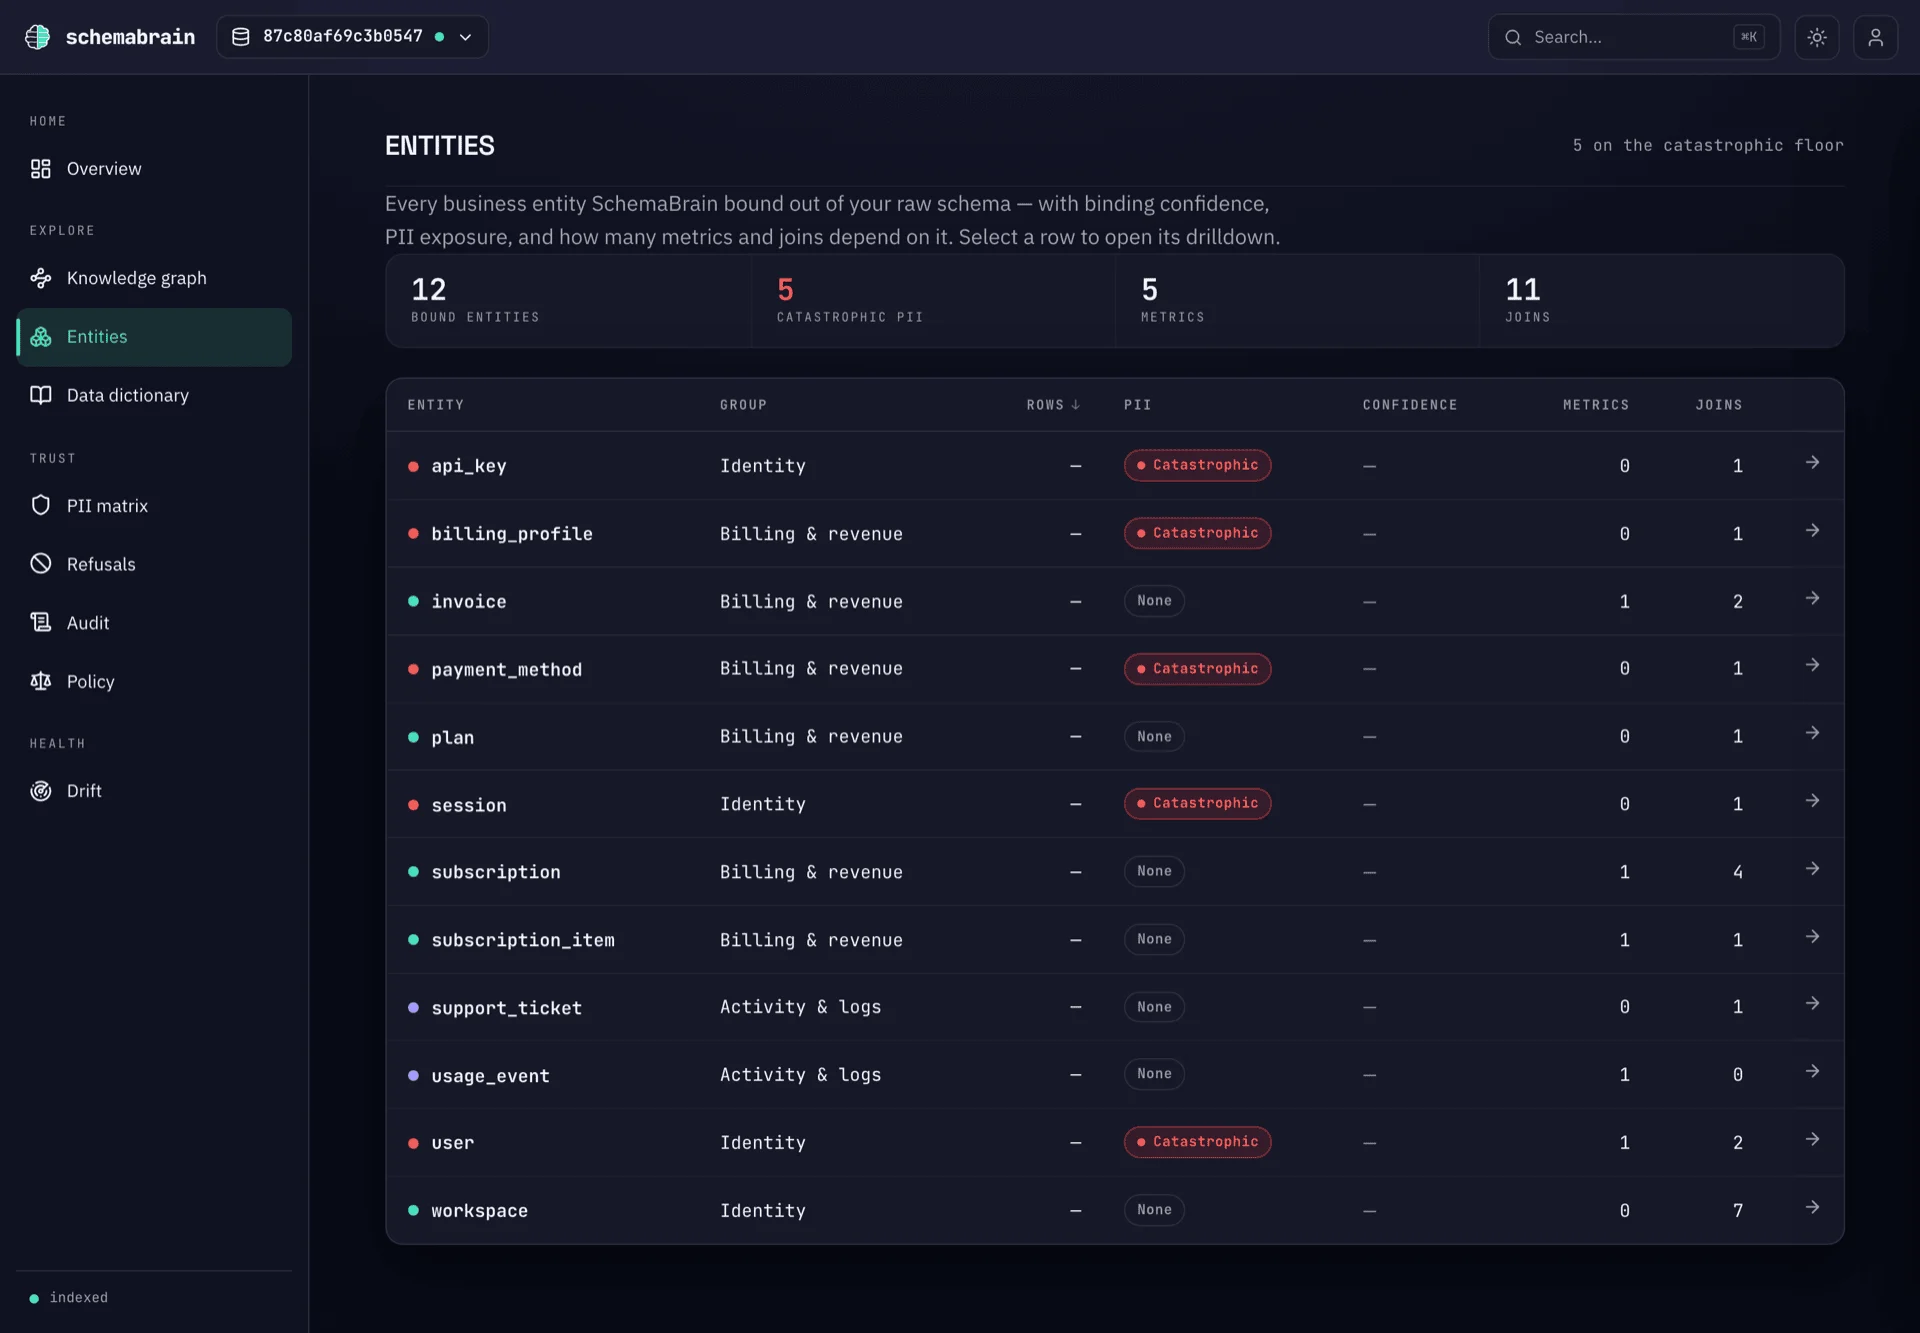
Entities — every business entity bound out of the raw schema, with PII exposure, binding confidence, metrics, and join counts.
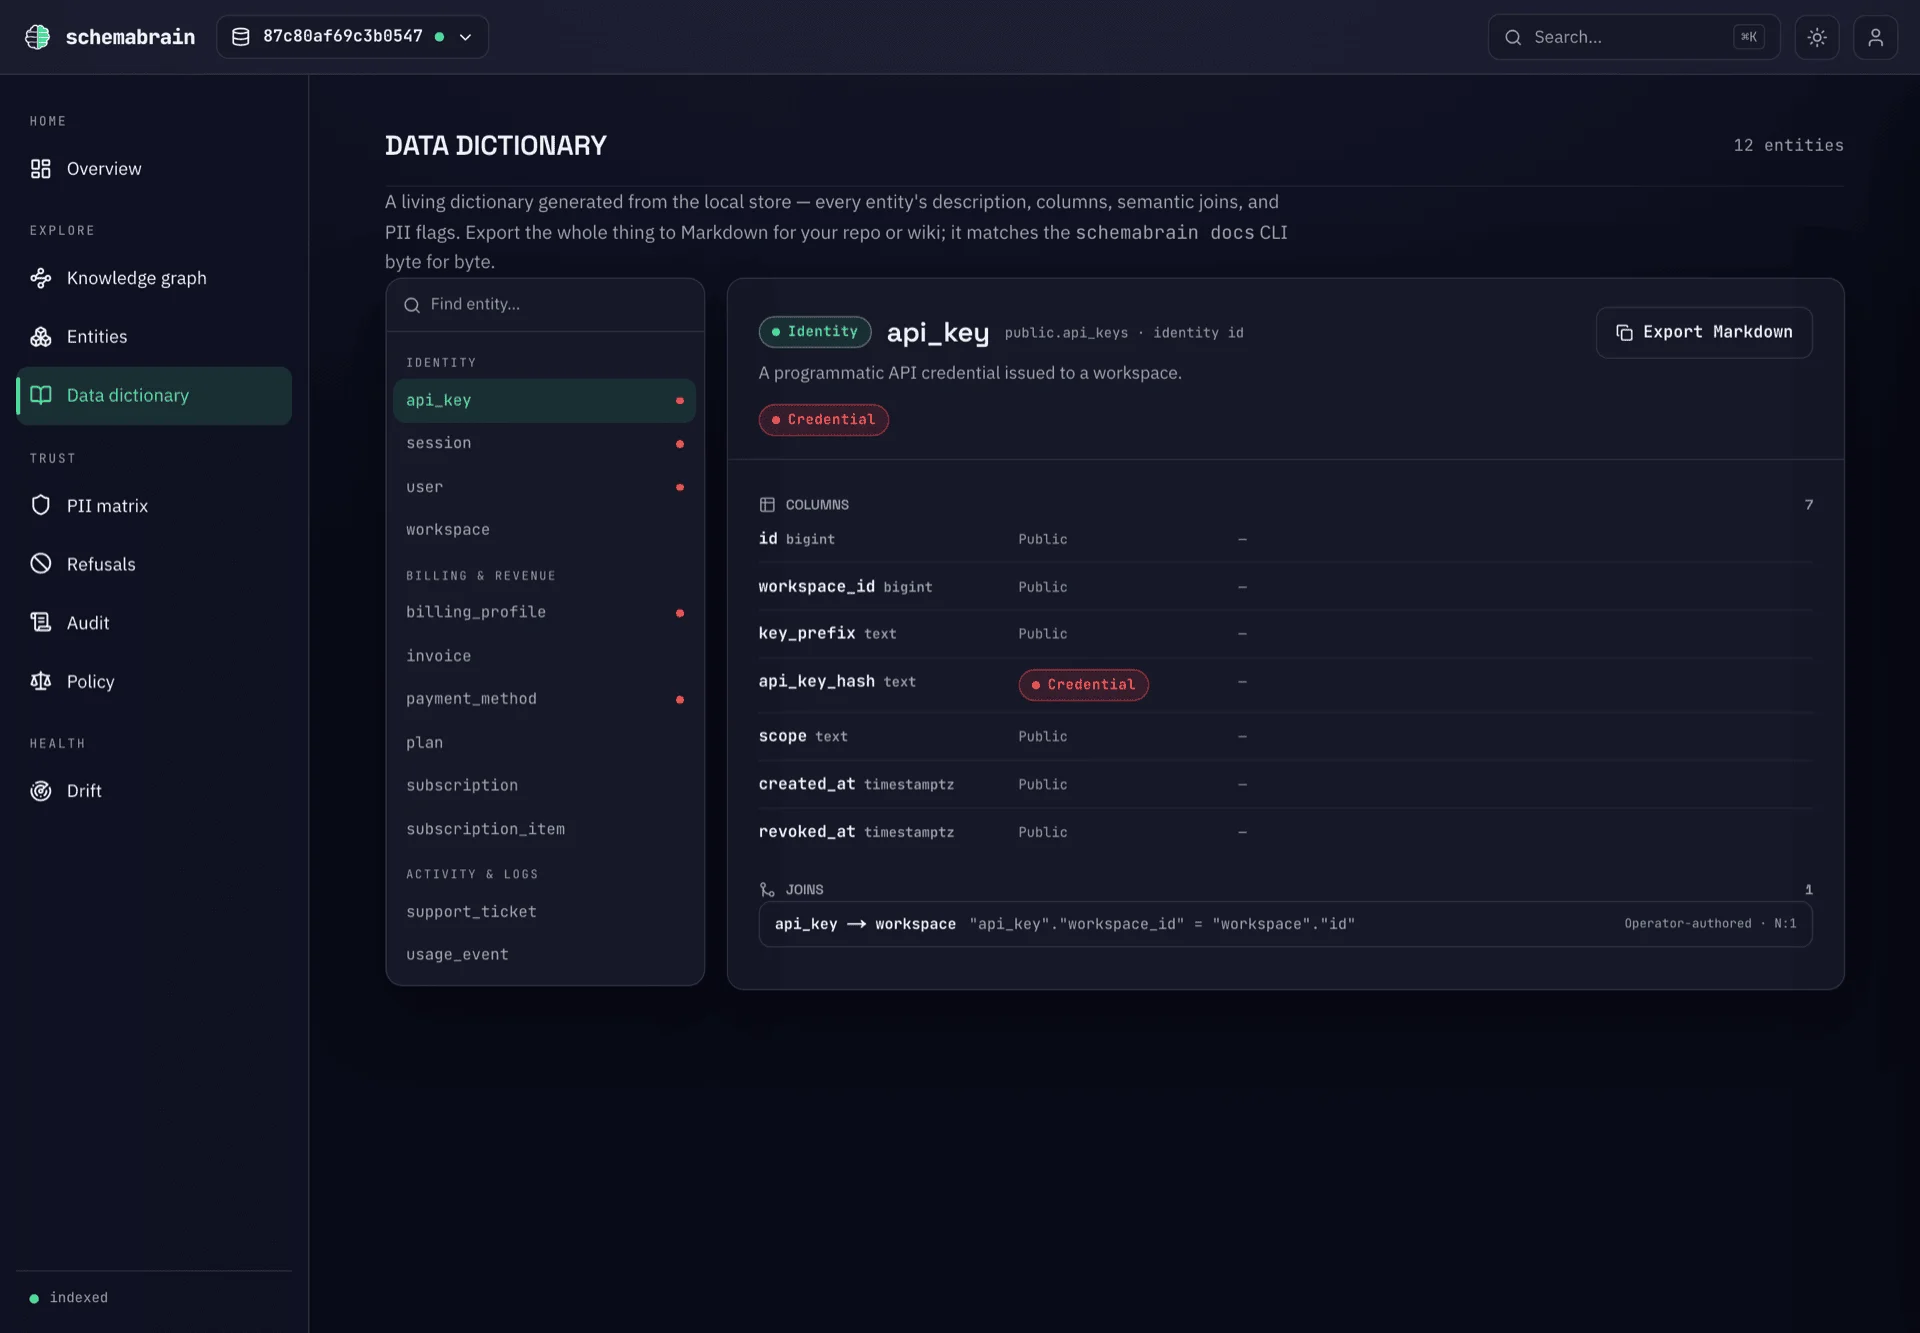
Data Dictionary — every table, column, type, PII class, and join, exportable to Markdown for your repo or wiki.
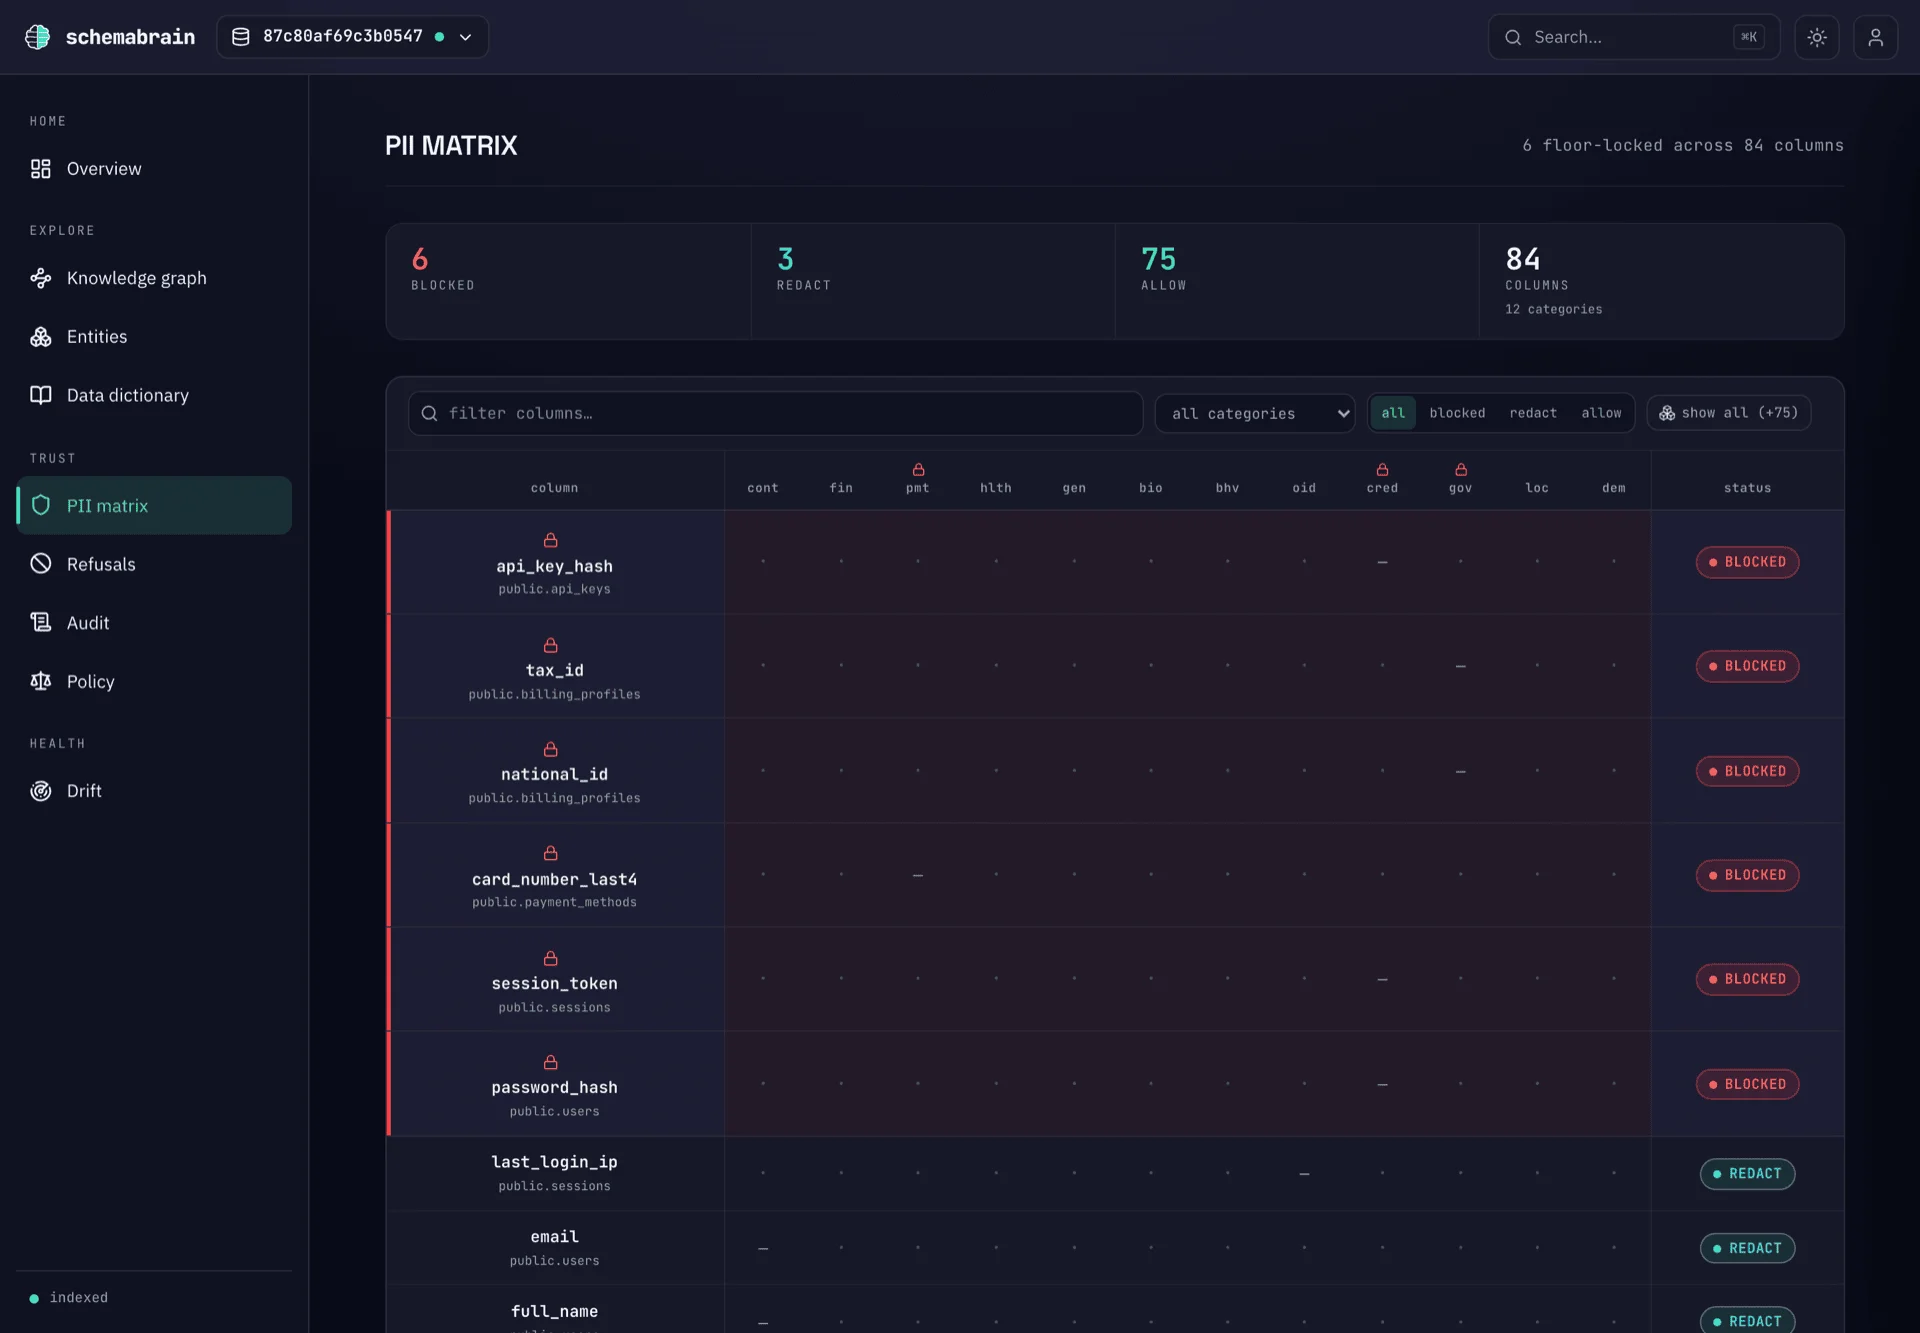
PII matrix — one row per classified column across the 12 PII categories, each tagged block / redact / allow; catastrophic columns are hard-blocked regardless of policy.
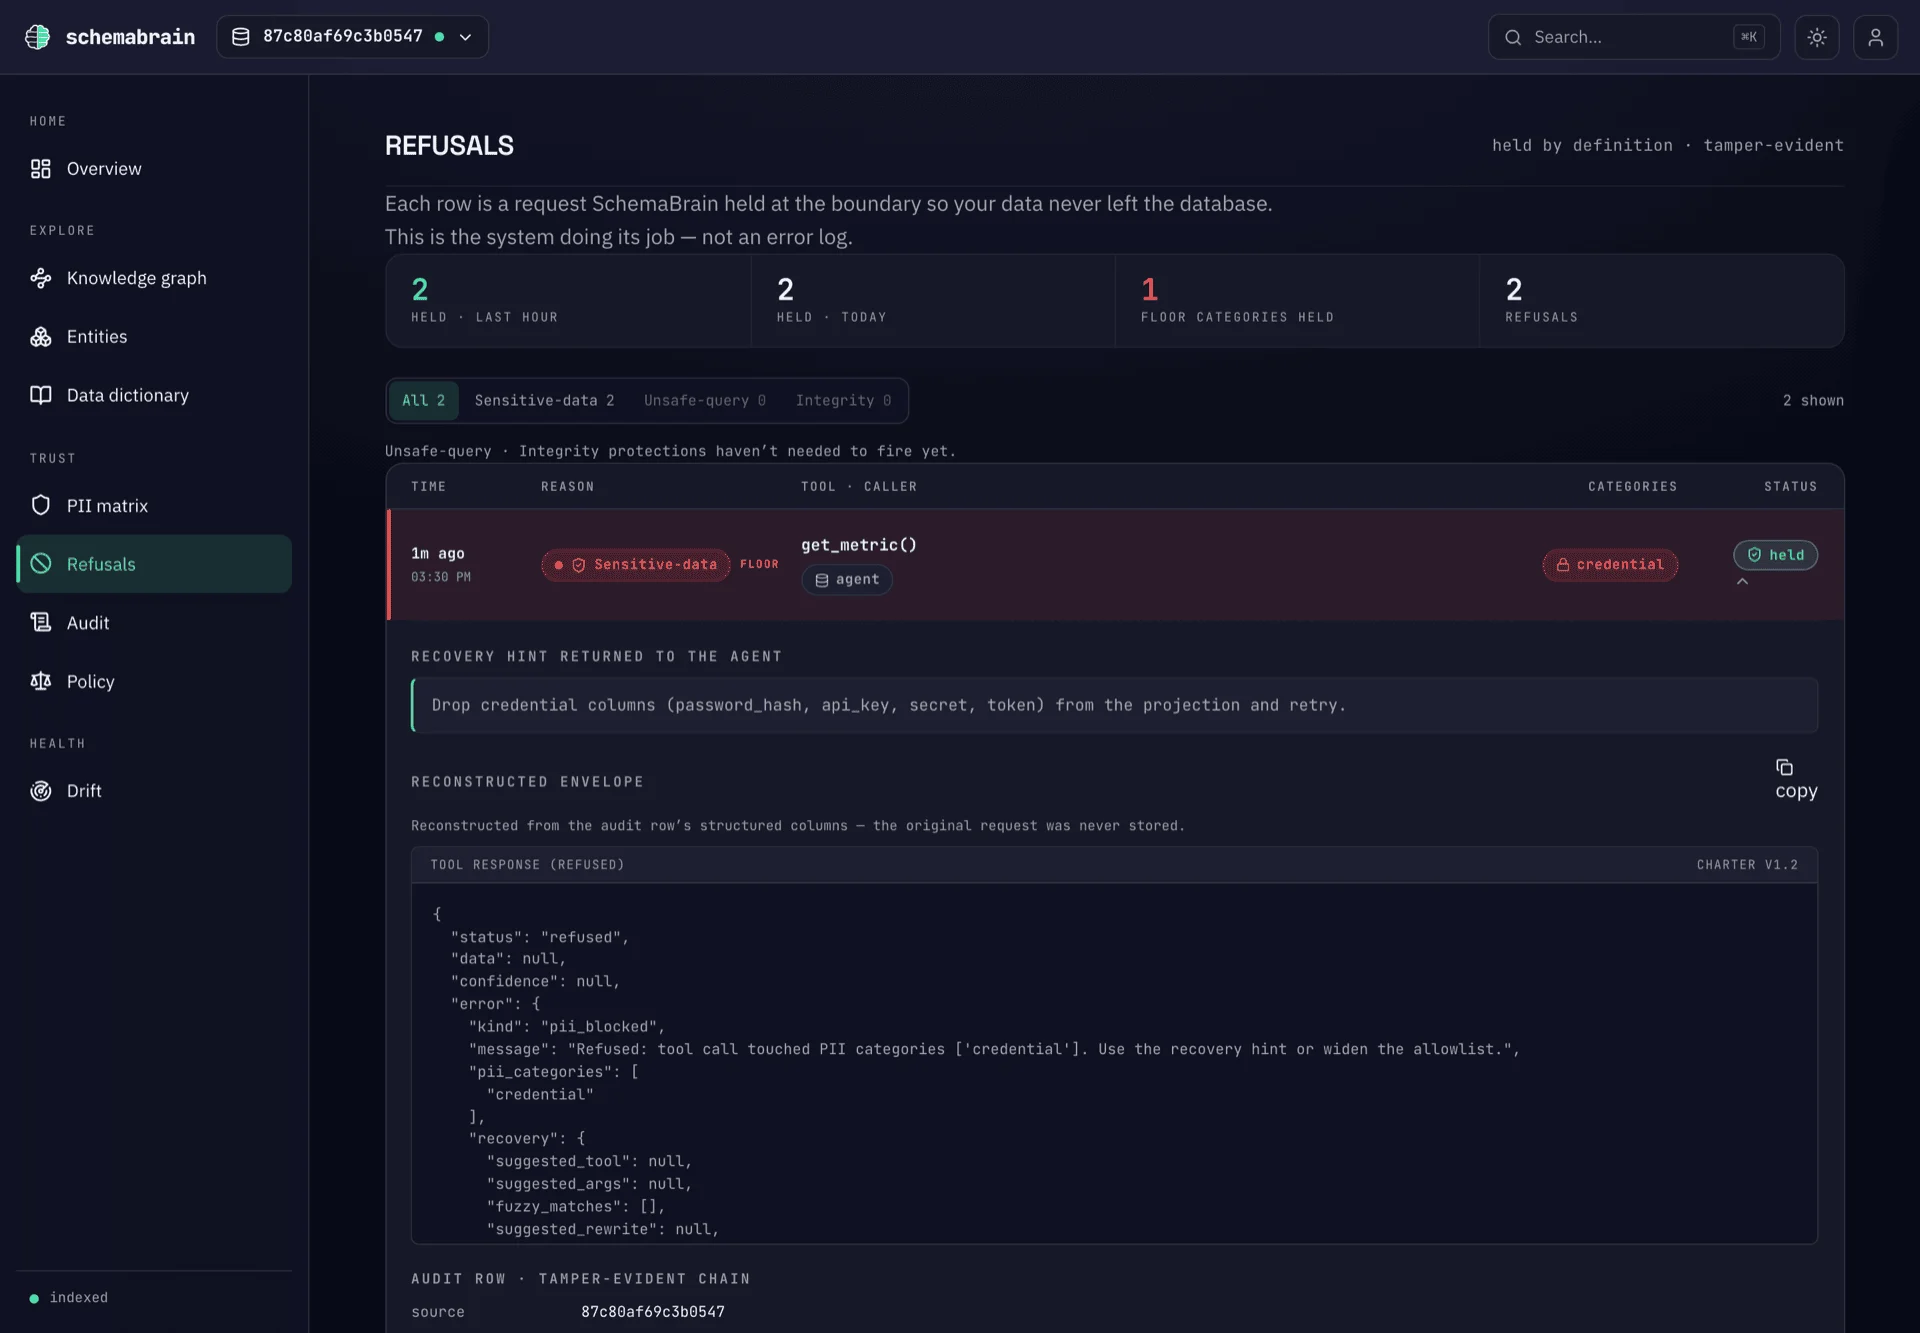
Refusals — every held call; expand a row to reveal the reason that fired, the blocked category set, the recovery hint, and the reconstructed envelope.
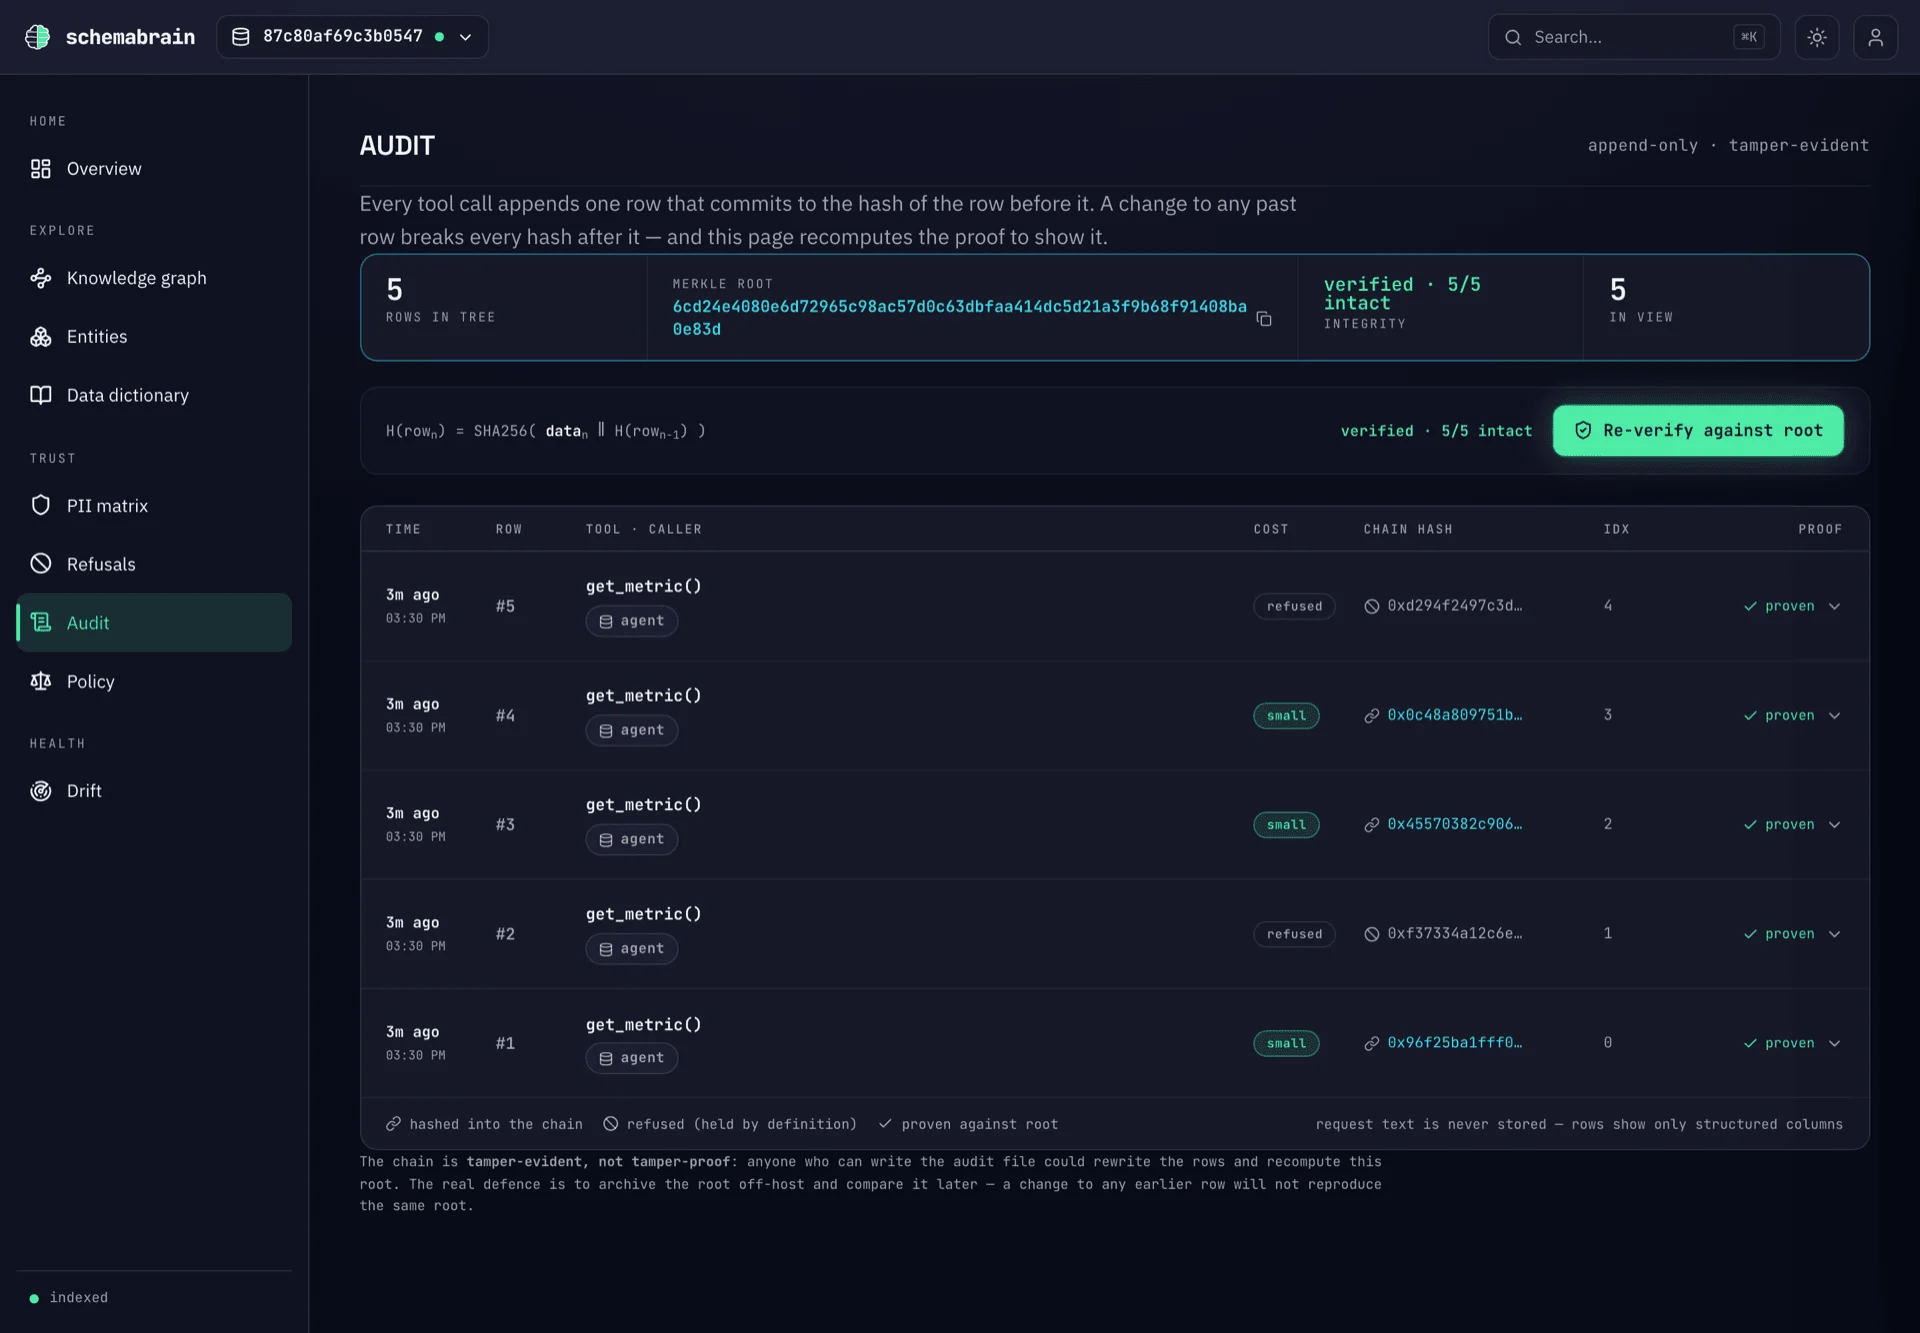
Audit Viewer — the tamper-evident chain spined by a derived Merkle root, re-walked and verified intact down to each row's inclusion proof.
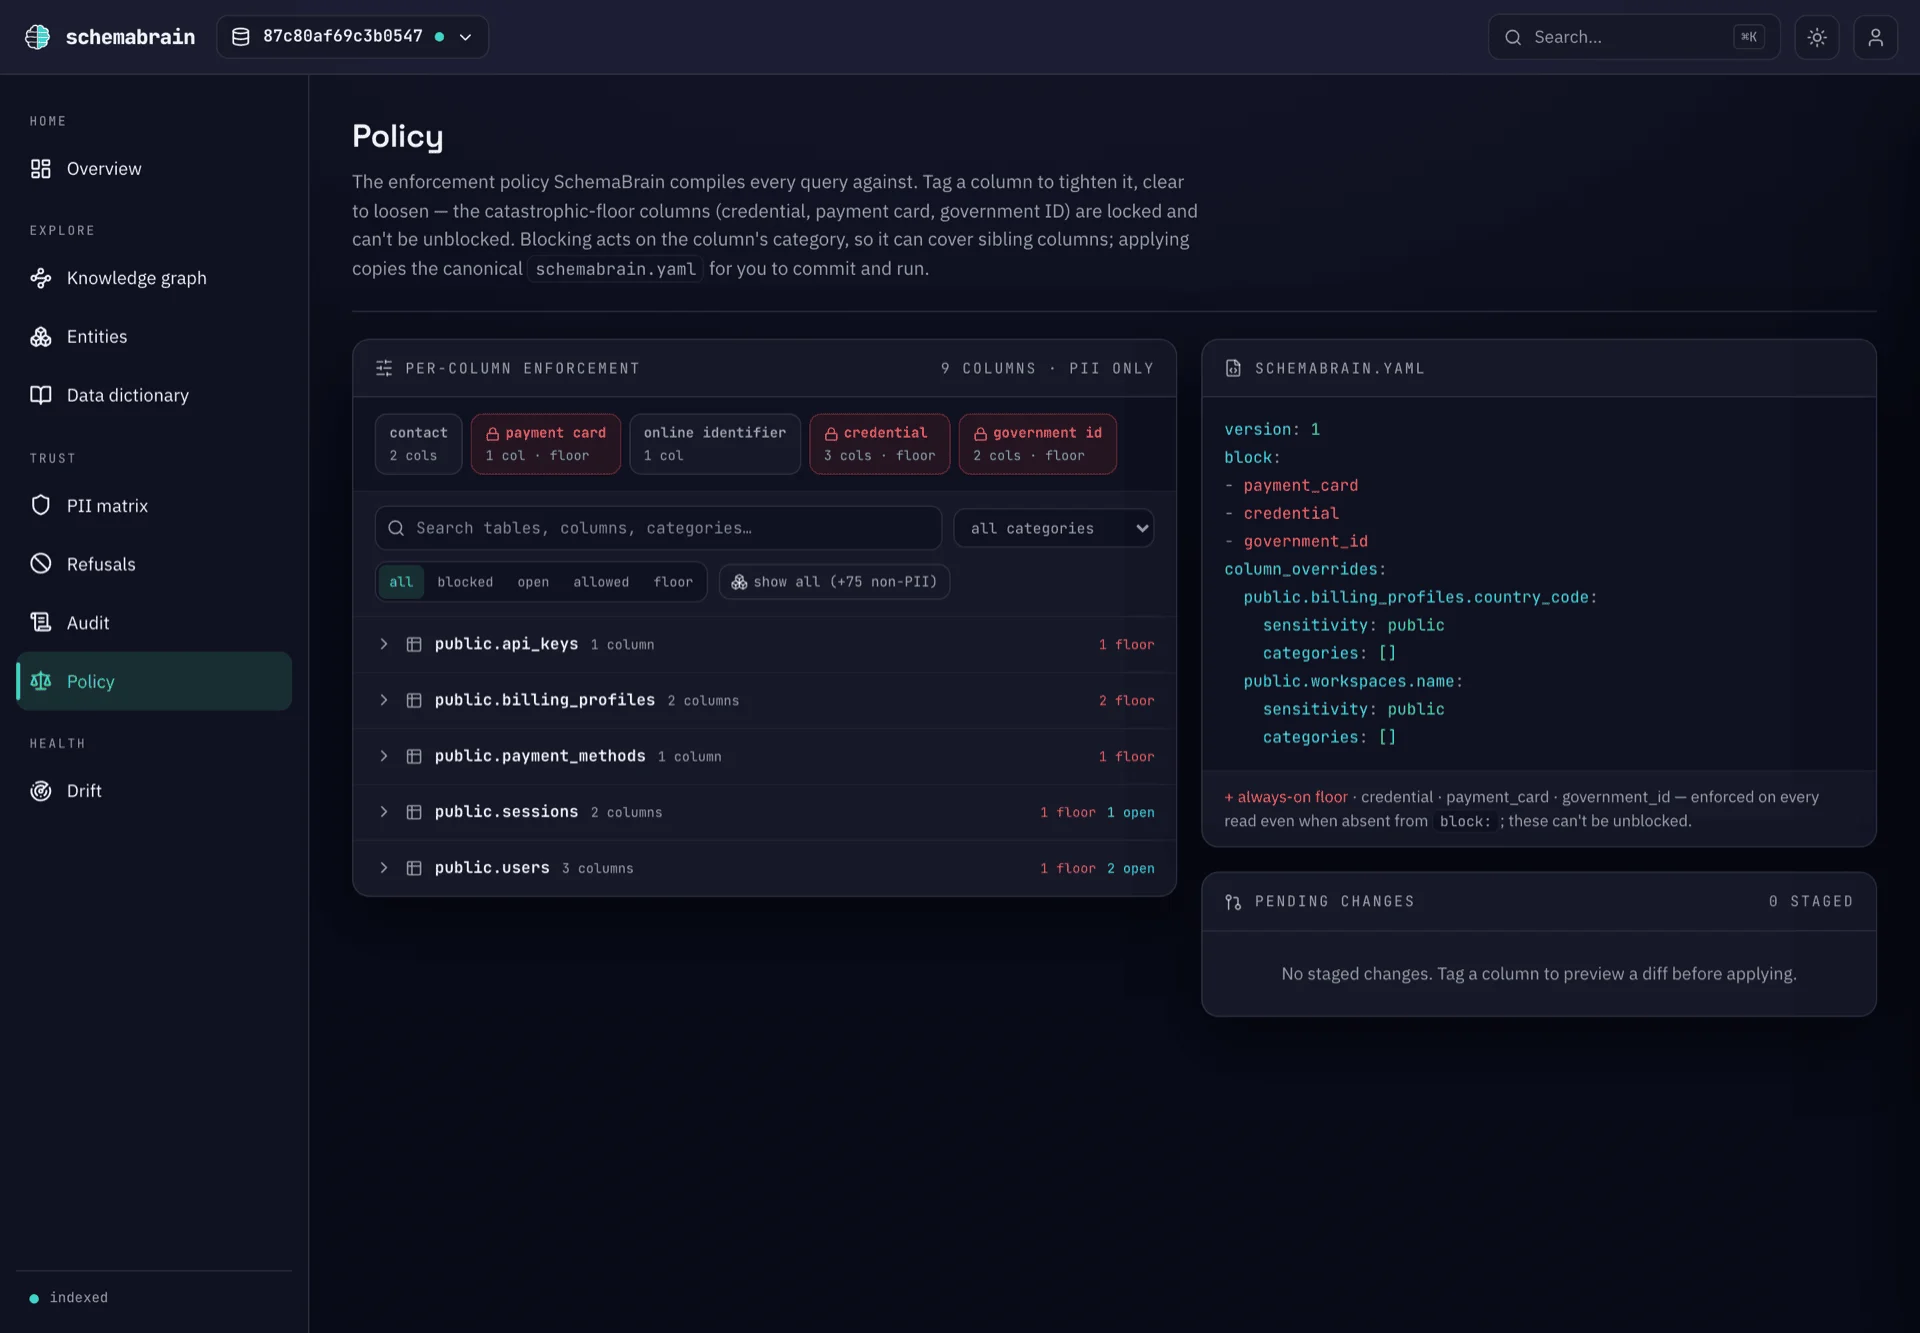
Policy — the block / redact / allow grid the firewall enforces, with the always-on catastrophic-leak floor disclosed and the schemabrain.yaml it compiles.
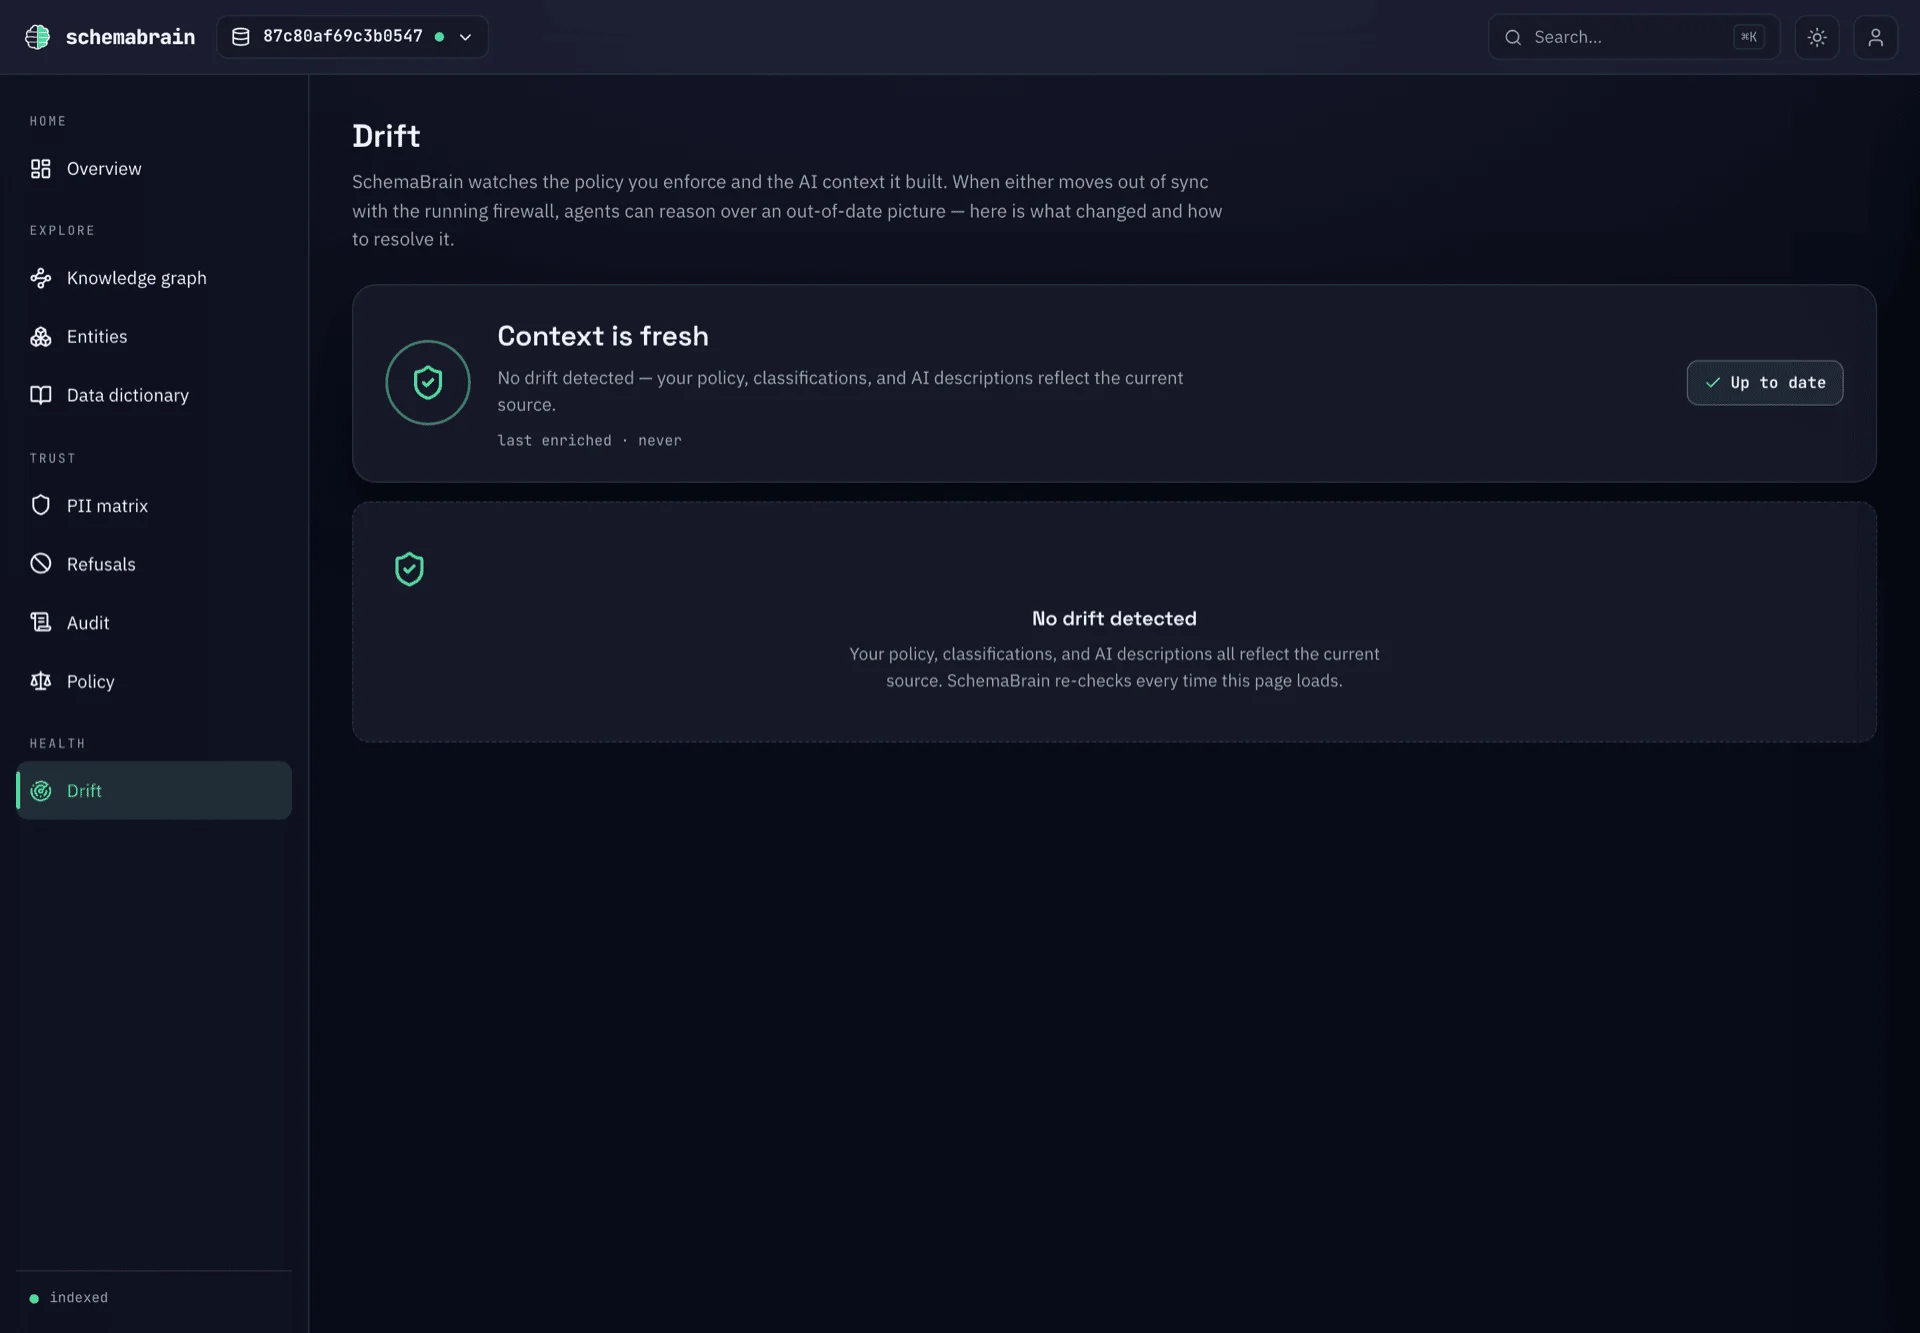
Drift — config and enrichment drift the store can detect, each with a copy-the-CLI fix; here, a fresh and in-sync context.
Install
The dashboard ships as an opt-in extra so the base install stays slim and free of web-server dependencies (fastapi, uvicorn, sse-starlette).
schemabrain/dashboard/static/. End users never need Node, npm, or pnpm. Contributor-dev runs are different — see the repo’s web/README.md.
Launch
Index your database first (or runschemabrain init), then point the dashboard at the same store:
--no-open in CI or on headless machines to skip the auto-open.
Flags
--host flag — by design. The bind host is a constant in schemabrain/dashboard/sidecar.py (BIND_HOST = "127.0.0.1"). The dashboard is local-only, full stop. Use SSH port-forwarding if you need to view a remote instance.What the sidecar exposes
The FastAPI app declares onlyGET routes. There is no POST, PUT, PATCH, or DELETE handler anywhere in the surface — a CI invariant test asserts this against the live route table.
X-Schemabrain-Charter-Version: 1.2— the MCP envelope contract.X-Schemabrain-Dashboard-Schema: 1.5— the dashboard JSON contract.
How source resolution works
TheuseSourceId() hook on the client and the _resolve_source() helper on the server share one rule: the dashboard never hardcodes a source ID. Resolution order:
- If the request includes
?source_connection_id=..., use it. - Else, if
SidecarConfig.source_connection_idwas set at boot, use it. - Else, ask the store for
list_distinct_source_connection_ids()and pick the first. - If the store knows about zero sources, return
nulland let the UI render an empty state.
schemabrain[ui] against a previously-indexed store “just works” — no flag plumbing required.
What the dashboard is not
- It is not a write surface. The sidecar declares no mutating verbs. The UI has no inputs that POST.
- It is not a SQL console. SchemaBrain does not execute arbitrary SQL anywhere — see
/mechanism/read-only. The dashboard inherits that posture. - It is not network-reachable. The bind host is hardcoded to
127.0.0.1. There is no flag, env var, or config file that changes this. - It is not authenticated. Because it binds to localhost, the dashboard relies on OS-level user isolation. Don’t run it on a shared multi-user machine without thinking through who owns
127.0.0.1. - It is not a settings editor. Curate entities, metrics, and joins via the CLI. The dashboard reflects state; it does not edit it.
- It does not include an entity browser. Editable entity workflows are post-v0.4.