> ## Documentation Index
> Fetch the complete documentation index at: https://schemabrain.mintlify.site/llms.txt
> Use this file to discover all available pages before exploring further.
# Local dashboard
> A read-only Next.js dashboard, served by a FastAPI sidecar bound to 127.0.0.1, that visualises PII coverage, refused tool calls, and the tamper-evident audit chain over the same SQLite store the MCP server uses.
# Local dashboard
**One-line claim:** `schemabrain dashboard` boots a FastAPI sidecar on `127.0.0.1:7878` that serves a pre-built Next.js static export. The UI reads from the same SQLite store + `mcp_audit` table the MCP server writes to. No Node runtime, no network exposure, no write paths.
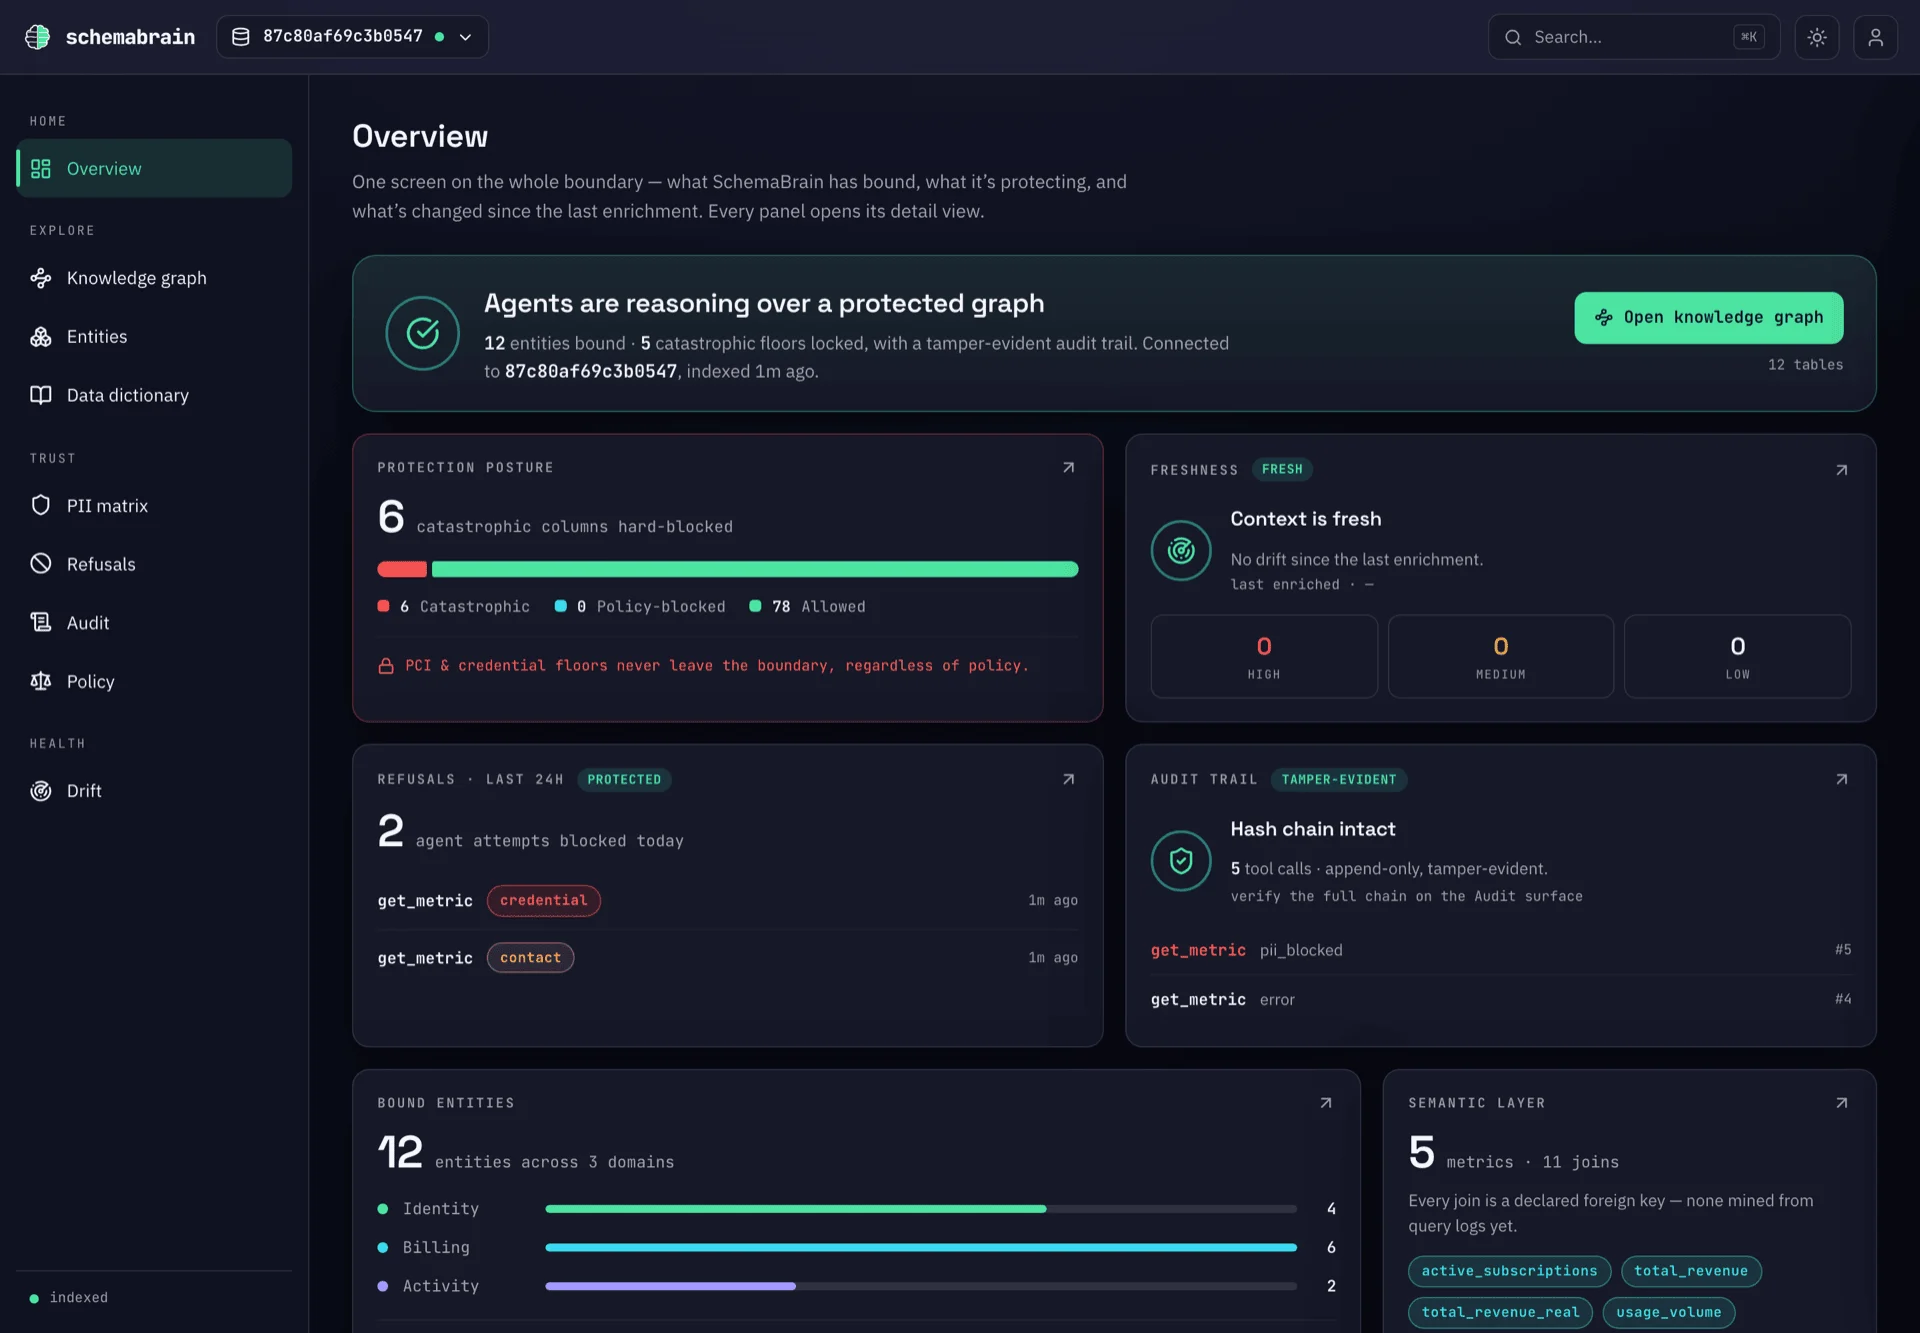
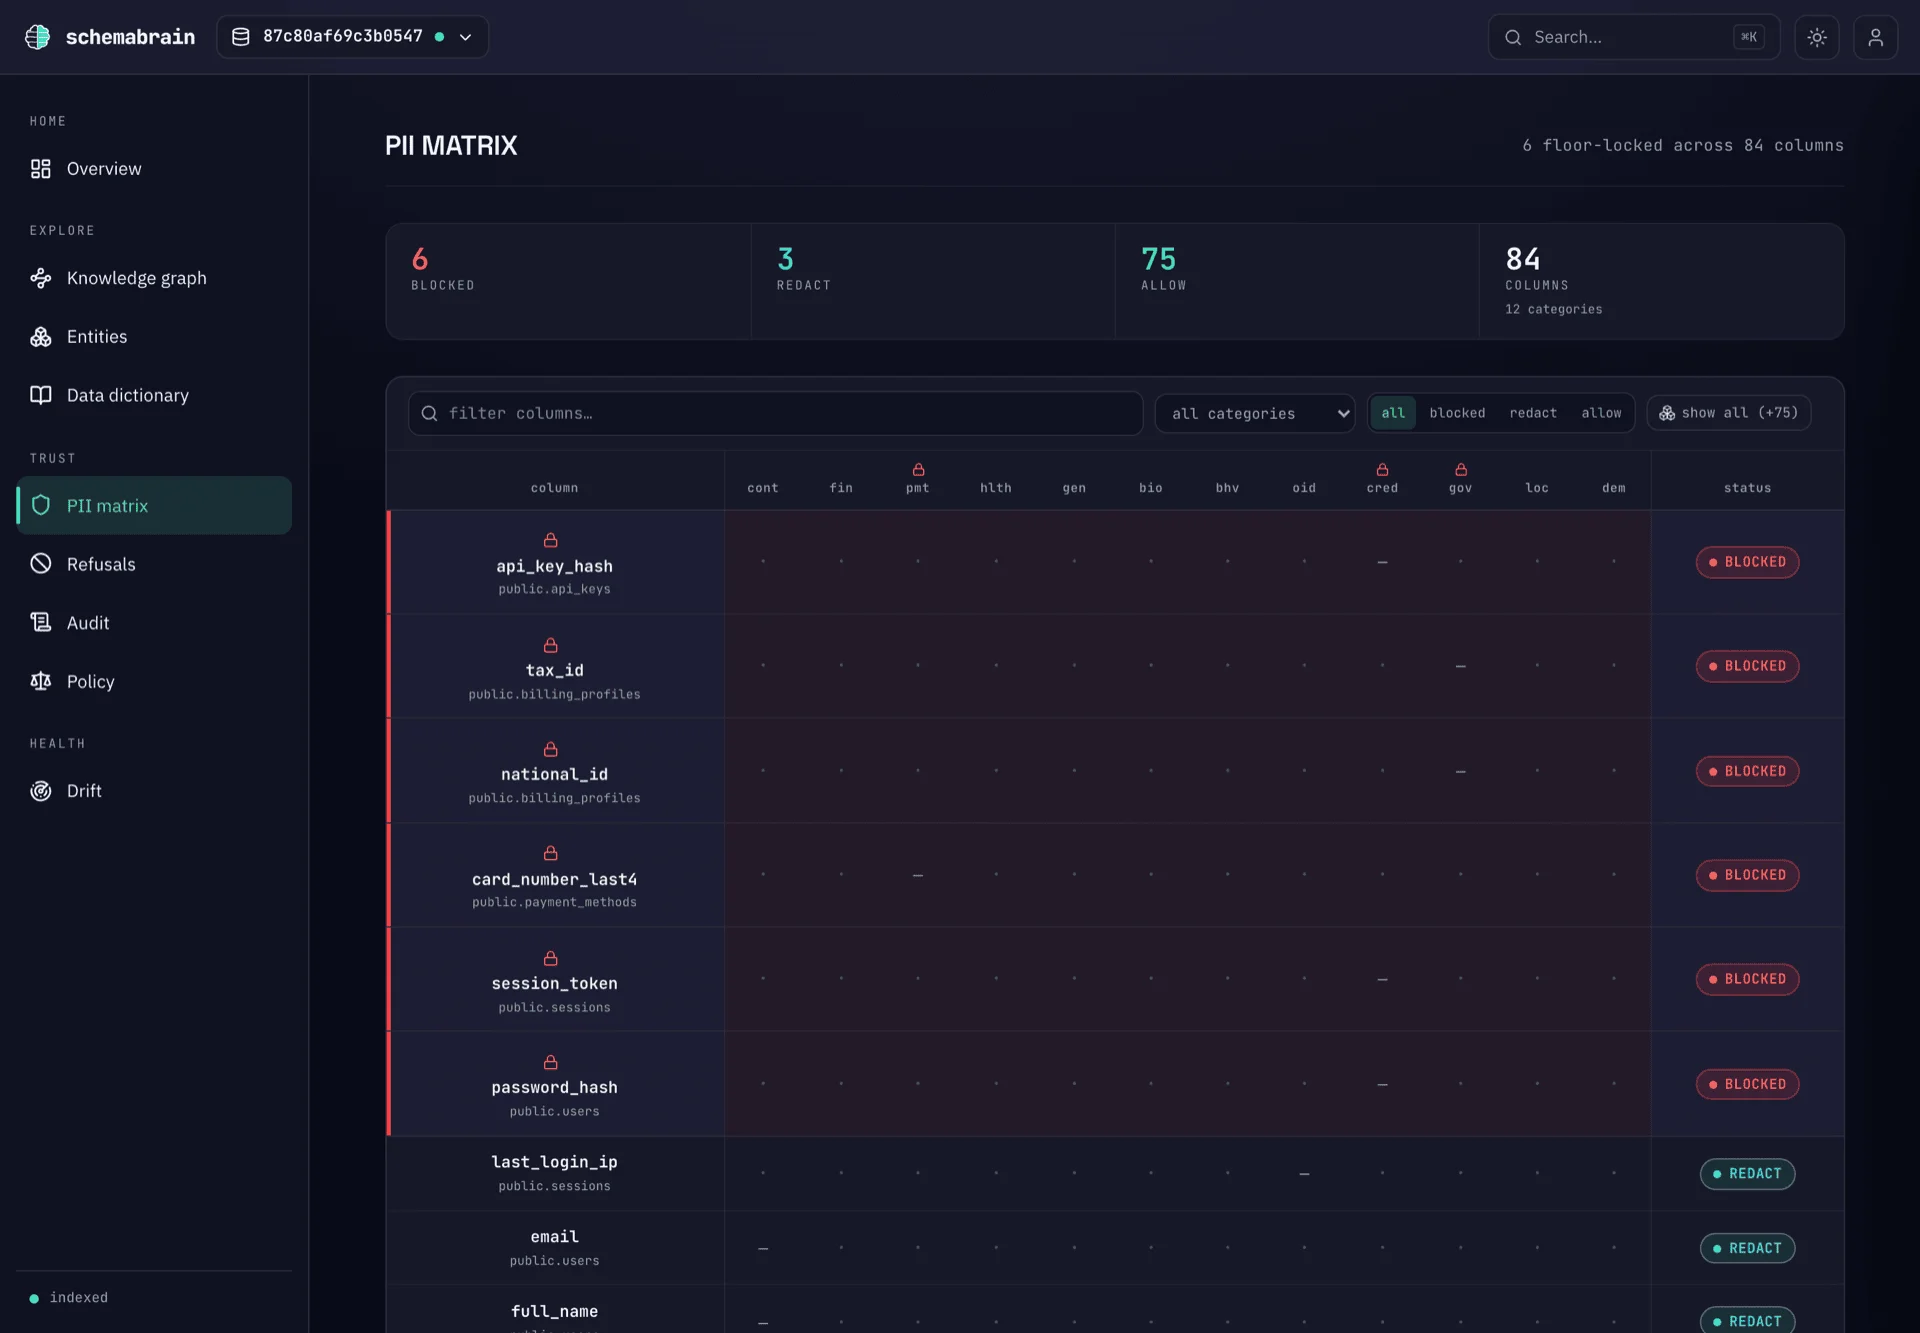
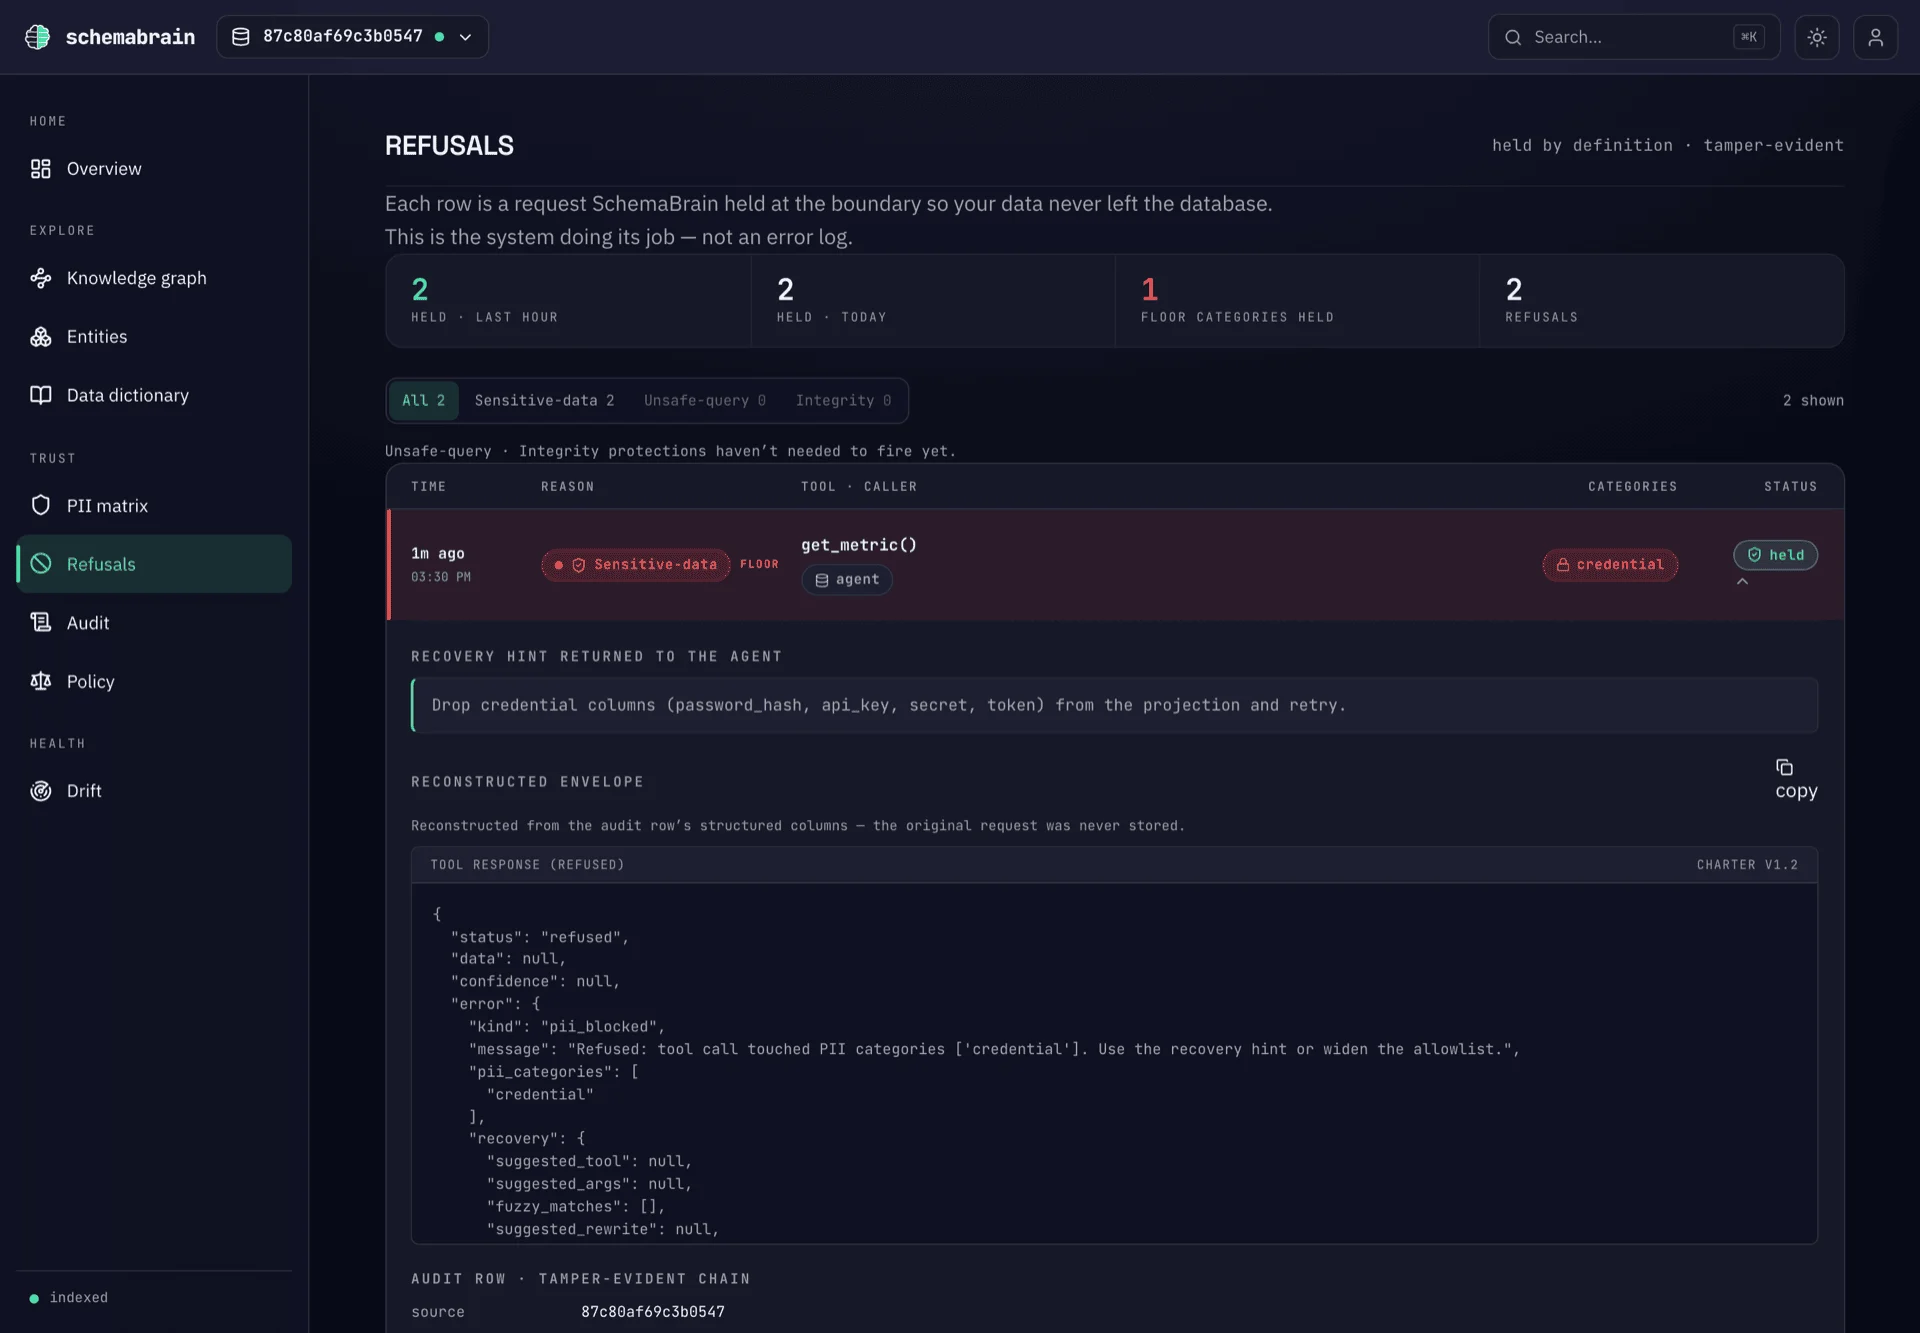
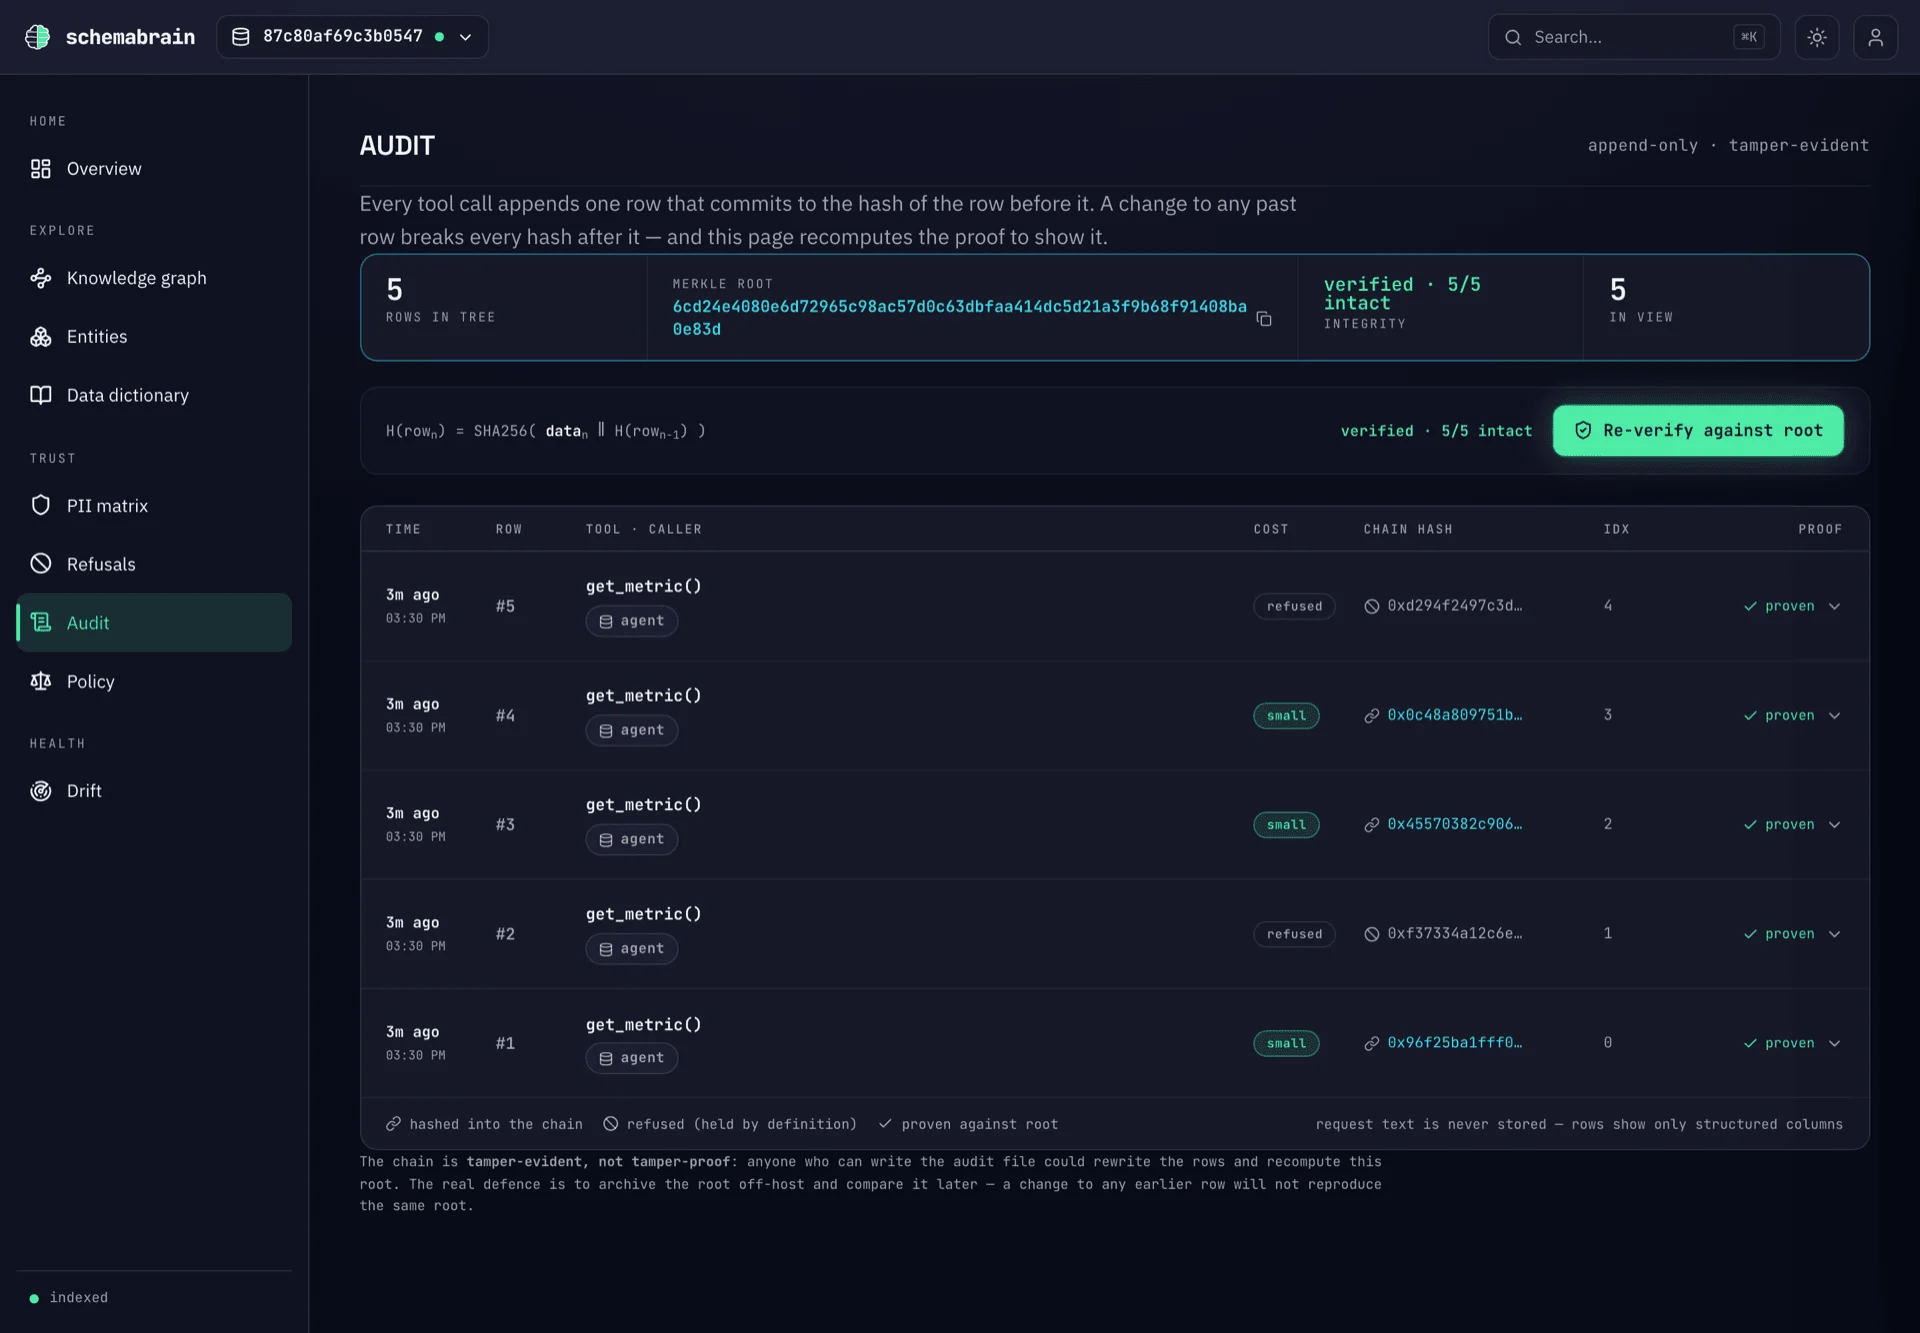
The dashboard answers three operator questions that the MCP envelope alone does not surface visually:
1. **Which entities carry catastrophic-leak PII categories?** — see [PII matrix](/dashboard/pii-matrix).
2. **What did SchemaBrain refuse, and what envelope did the agent receive?** — see [Refusals](/dashboard/refusals).
3. **Is the hash-chained audit log still intact?** — see [Audit Viewer](/dashboard/audit-viewer).
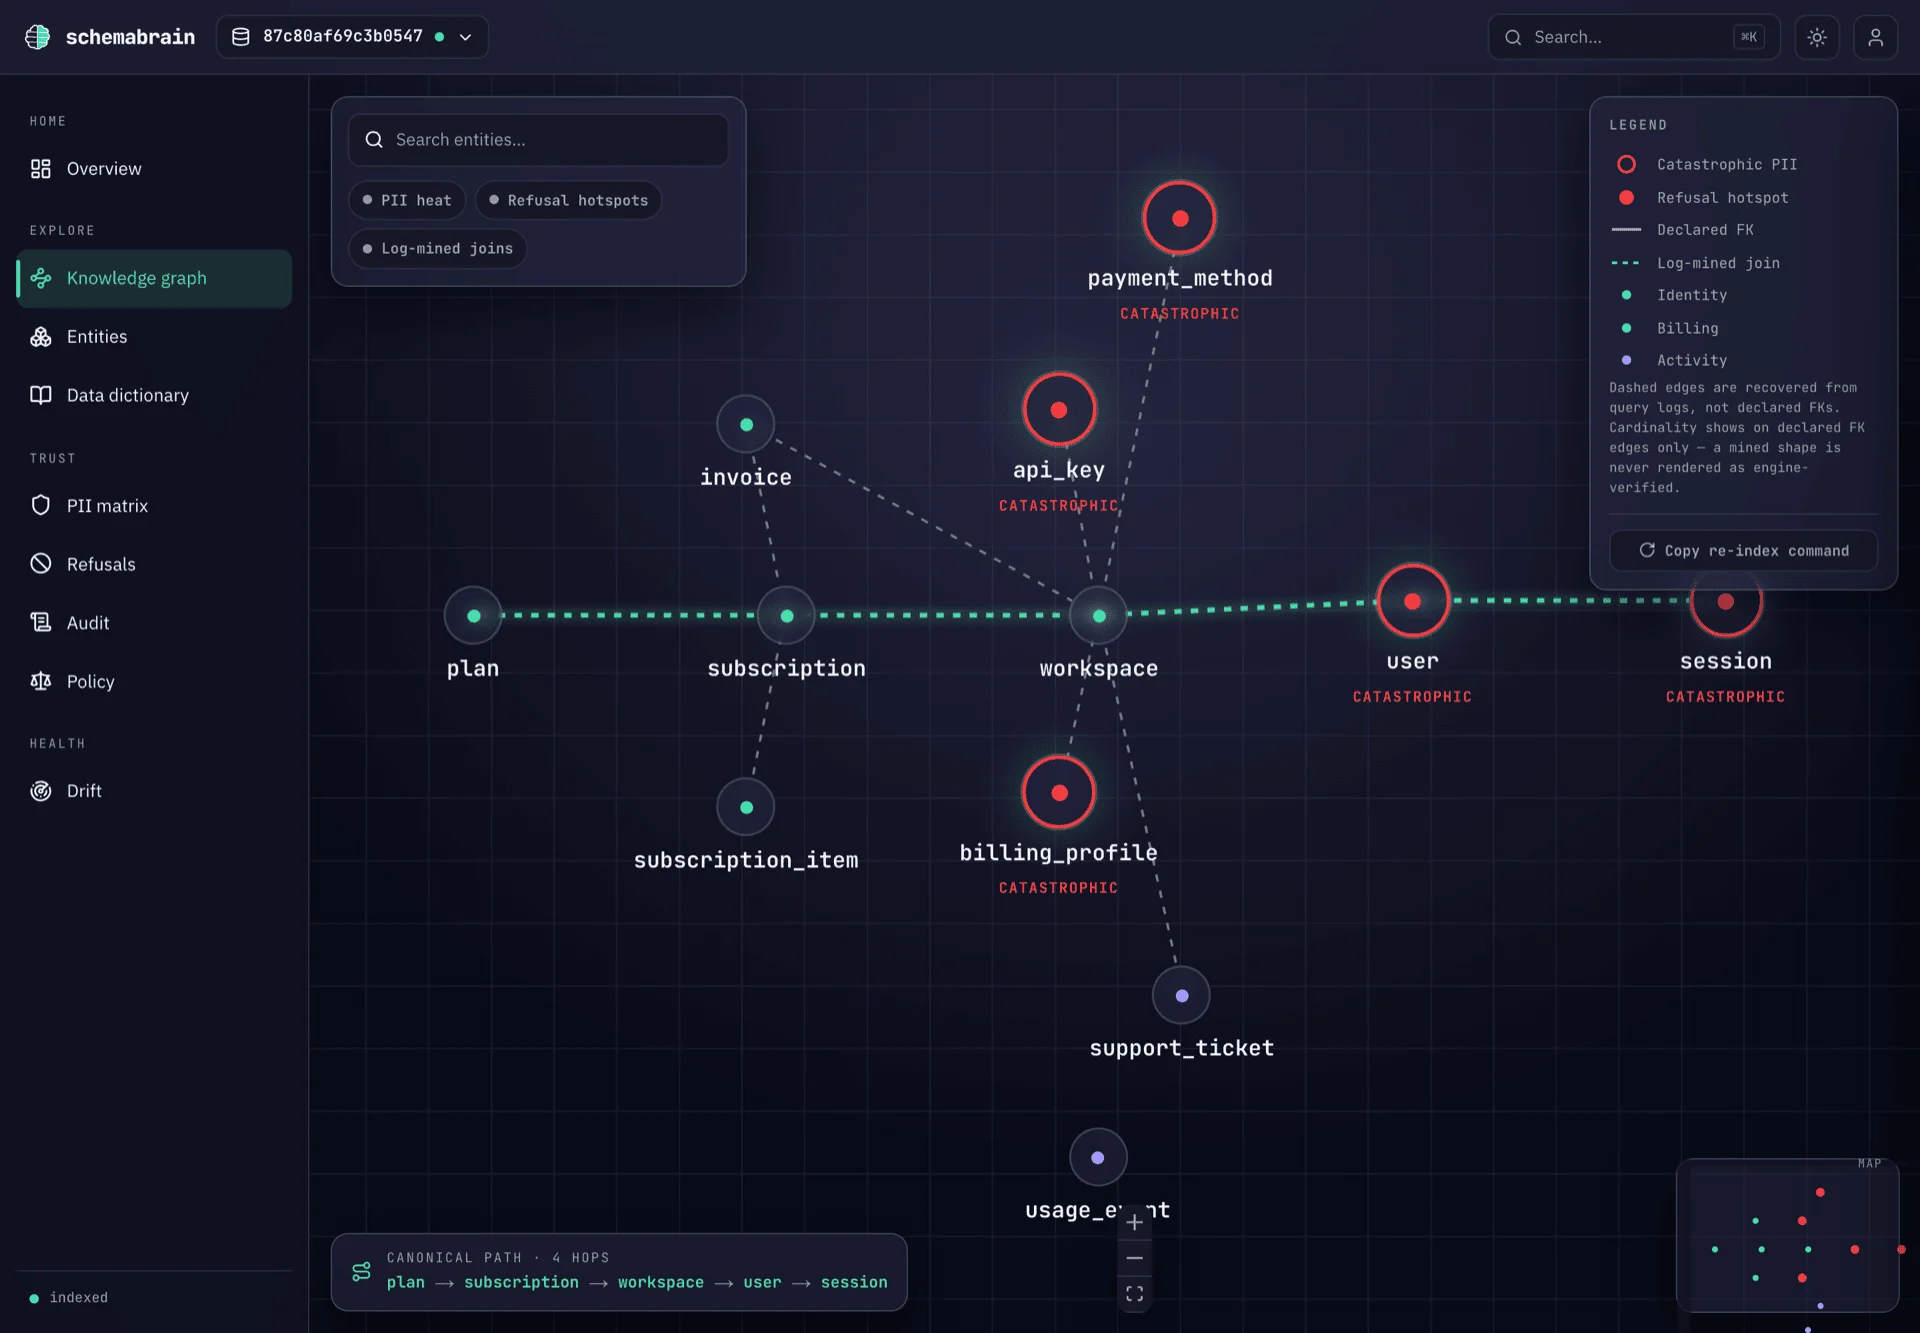
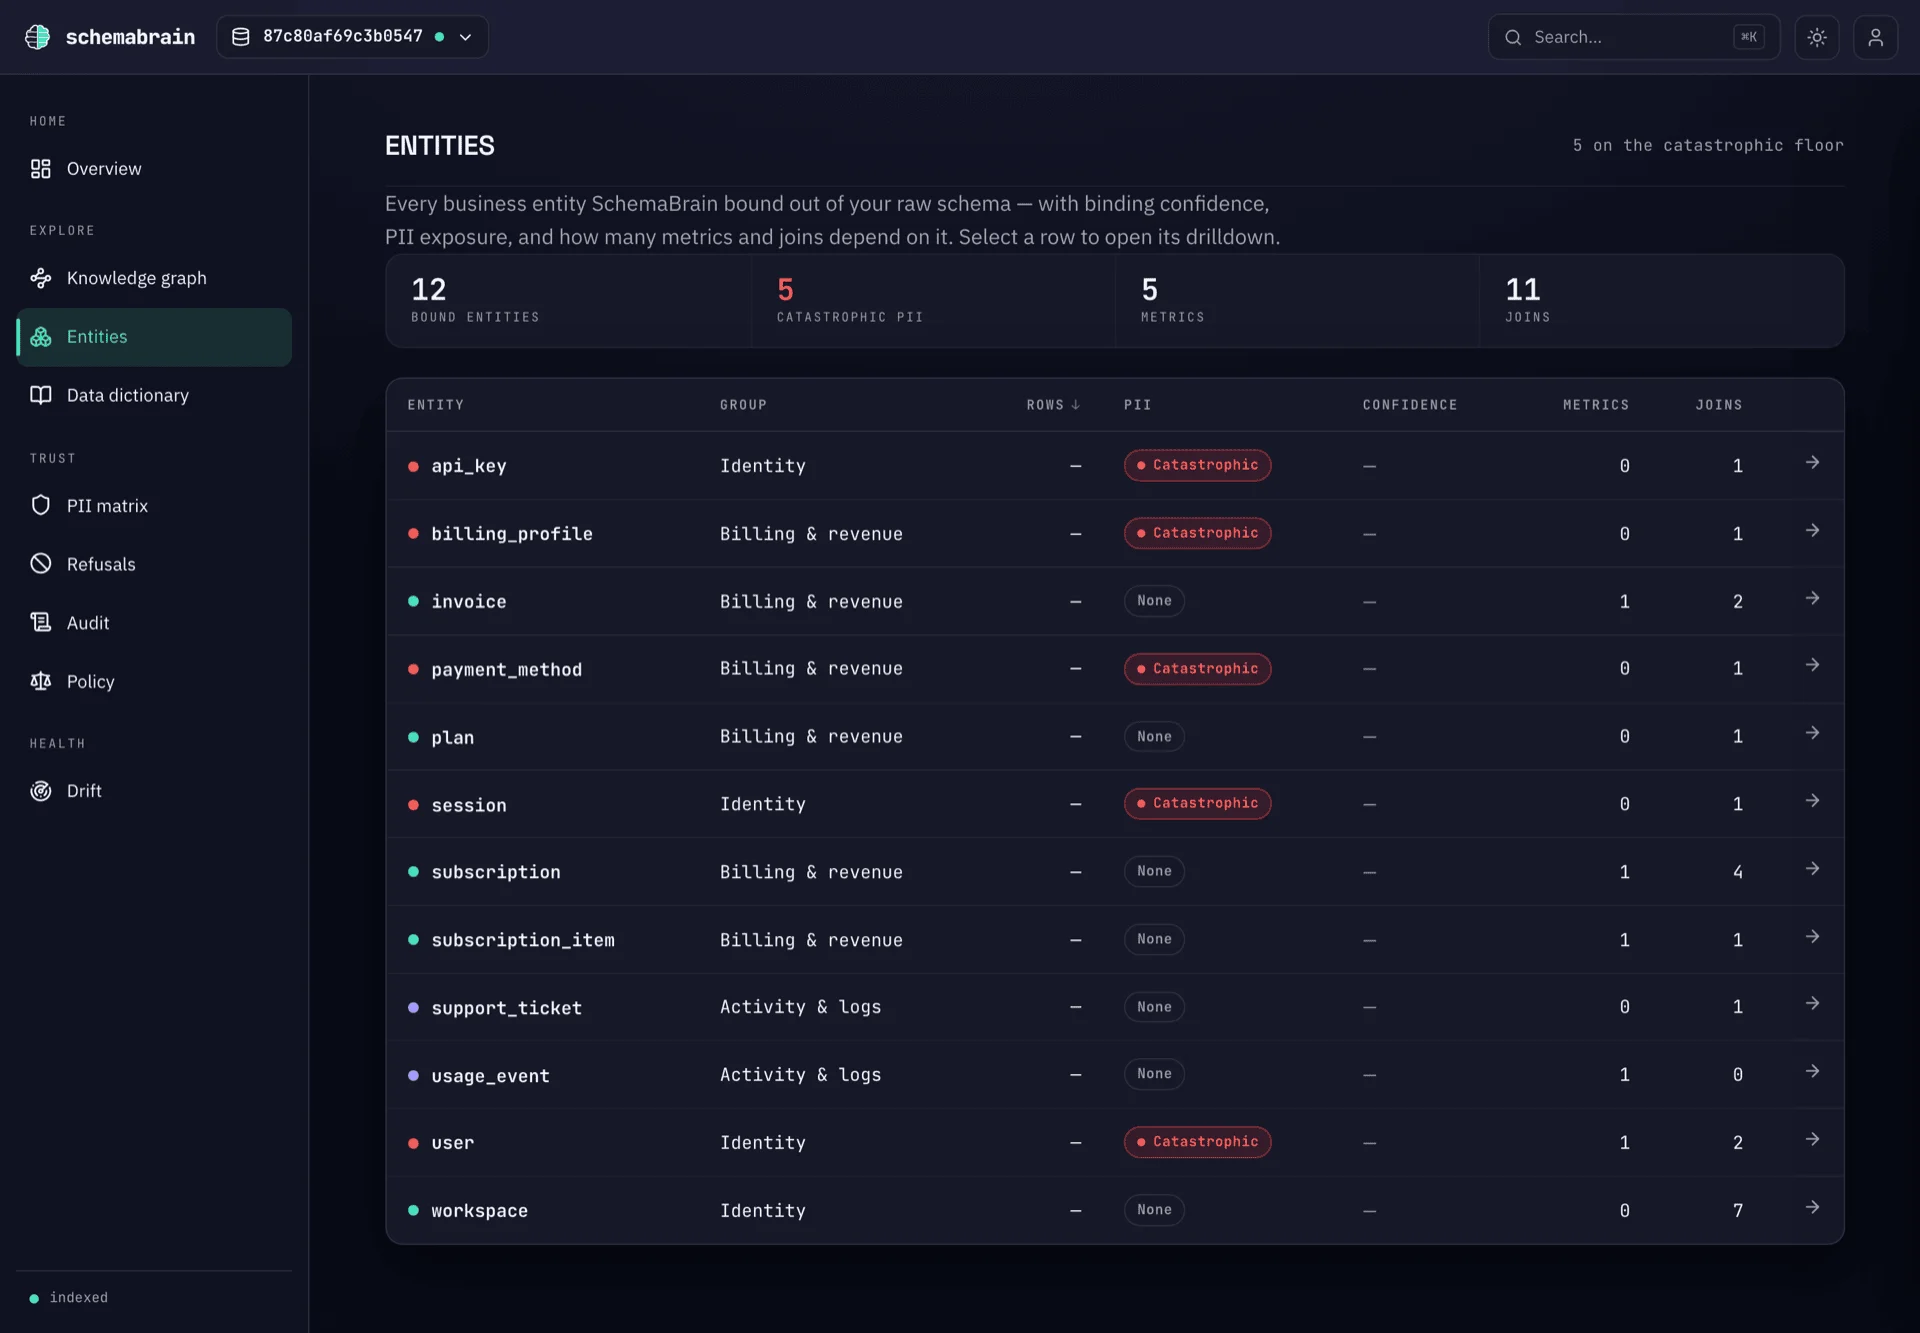
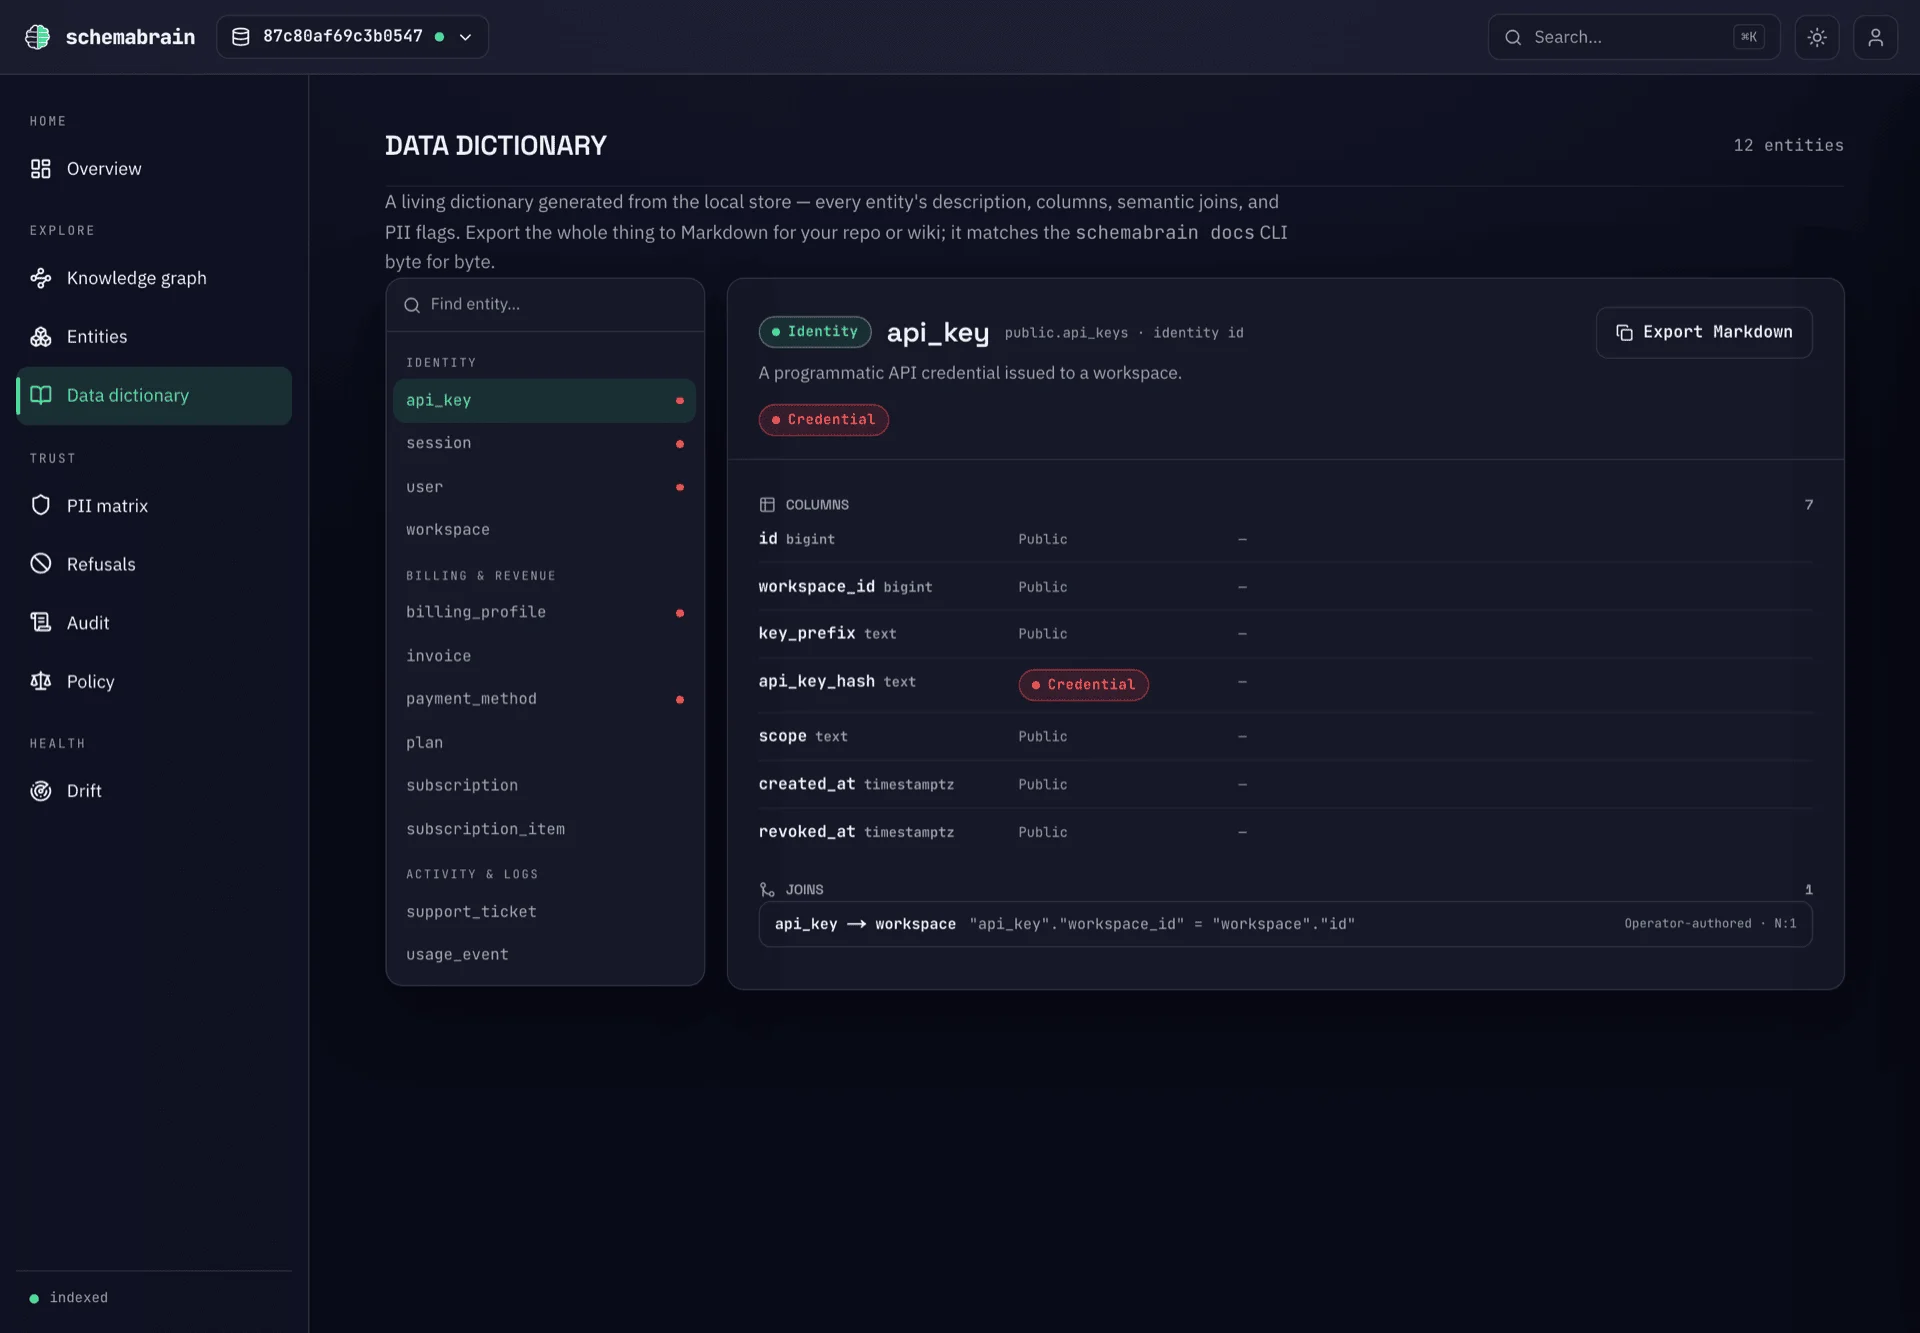
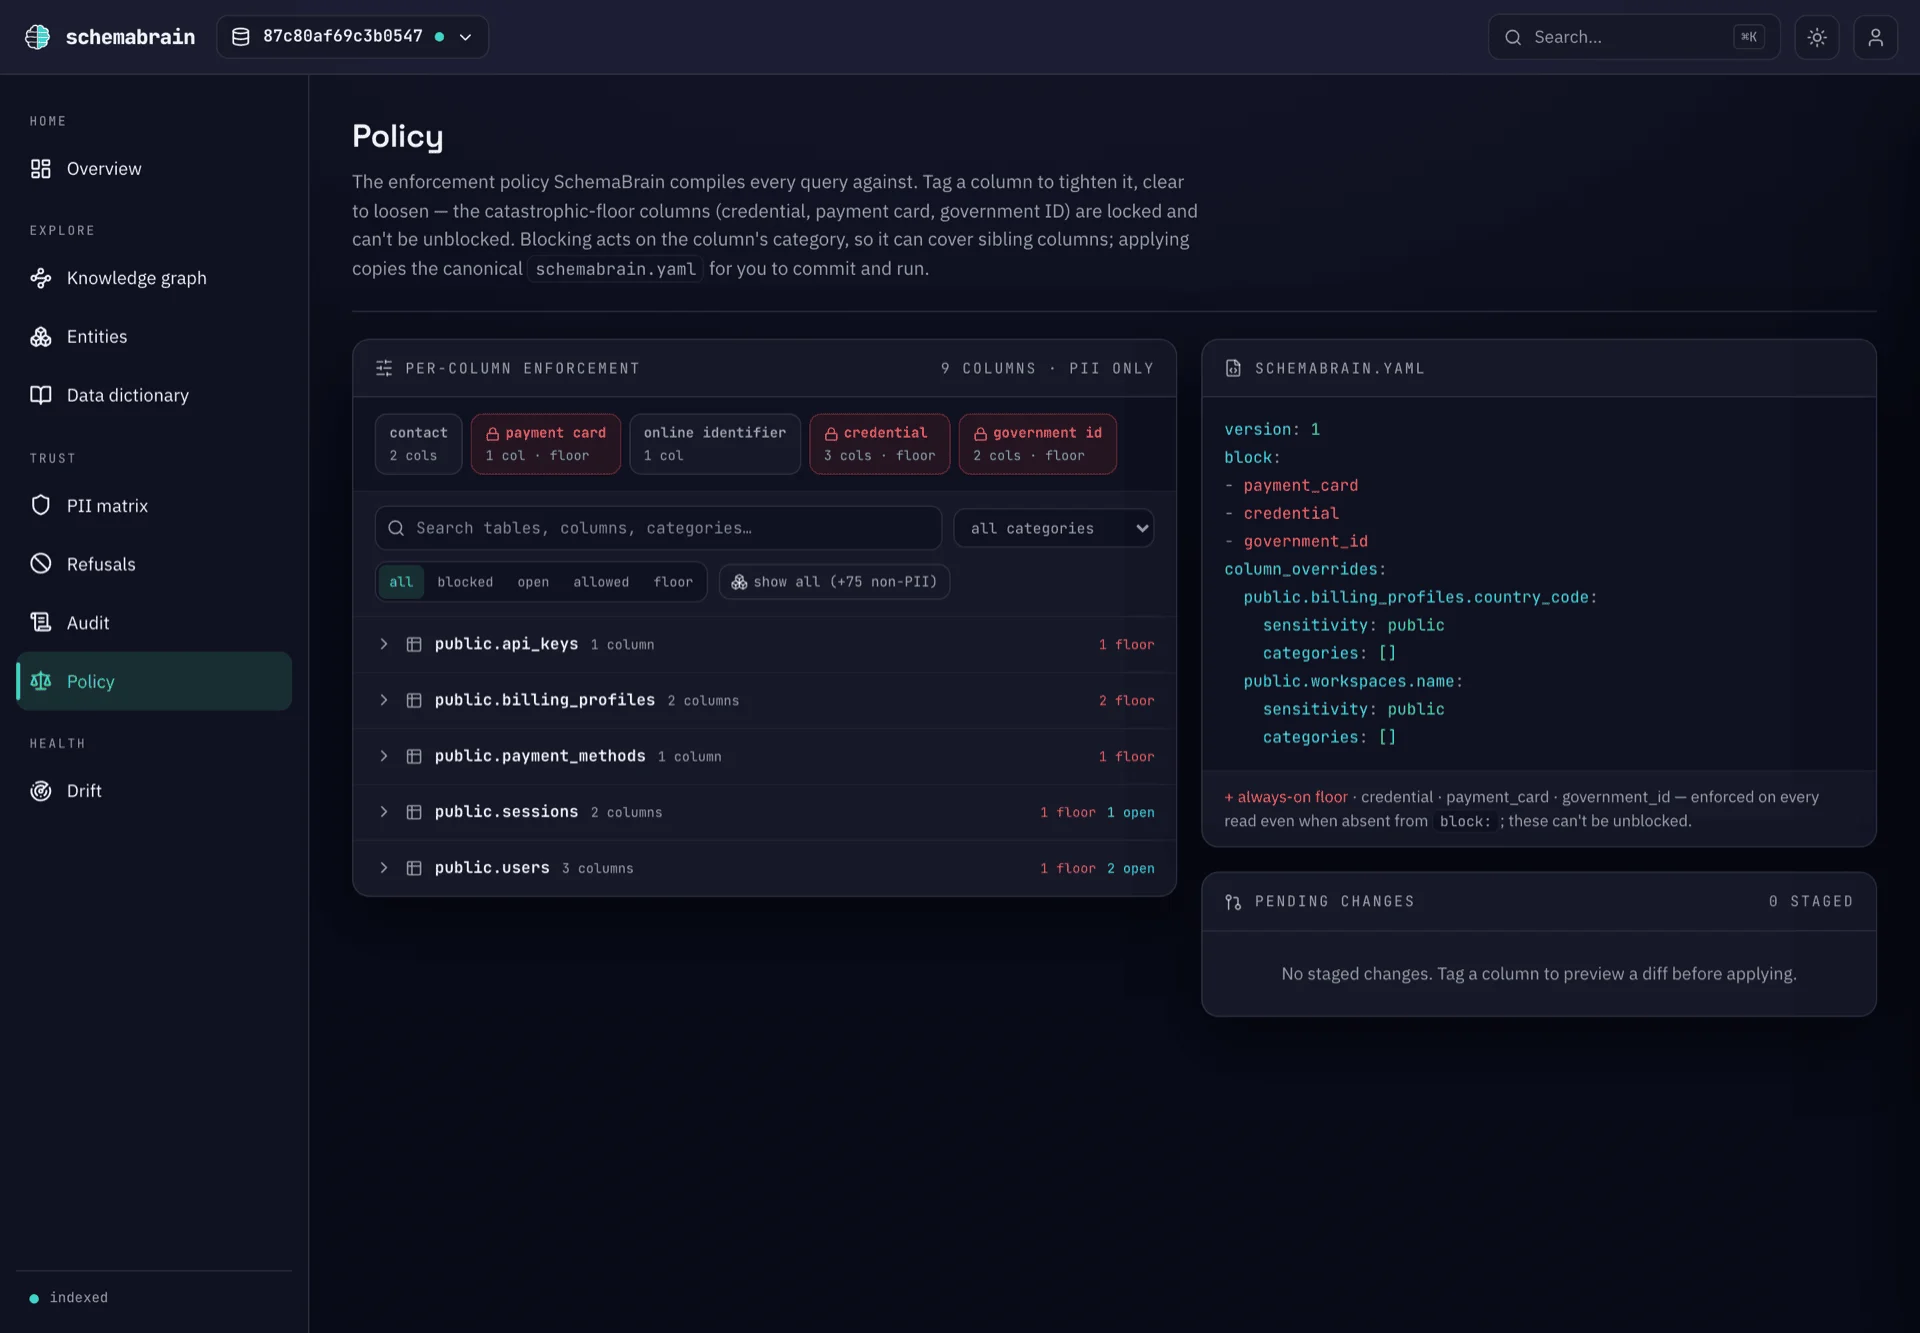
SchemaBrain renders **nine read-only surfaces** over that same store. The signature surface is the **Knowledge Graph** — your schema as the entity-relationship projection the semantic layer compiles joins against.
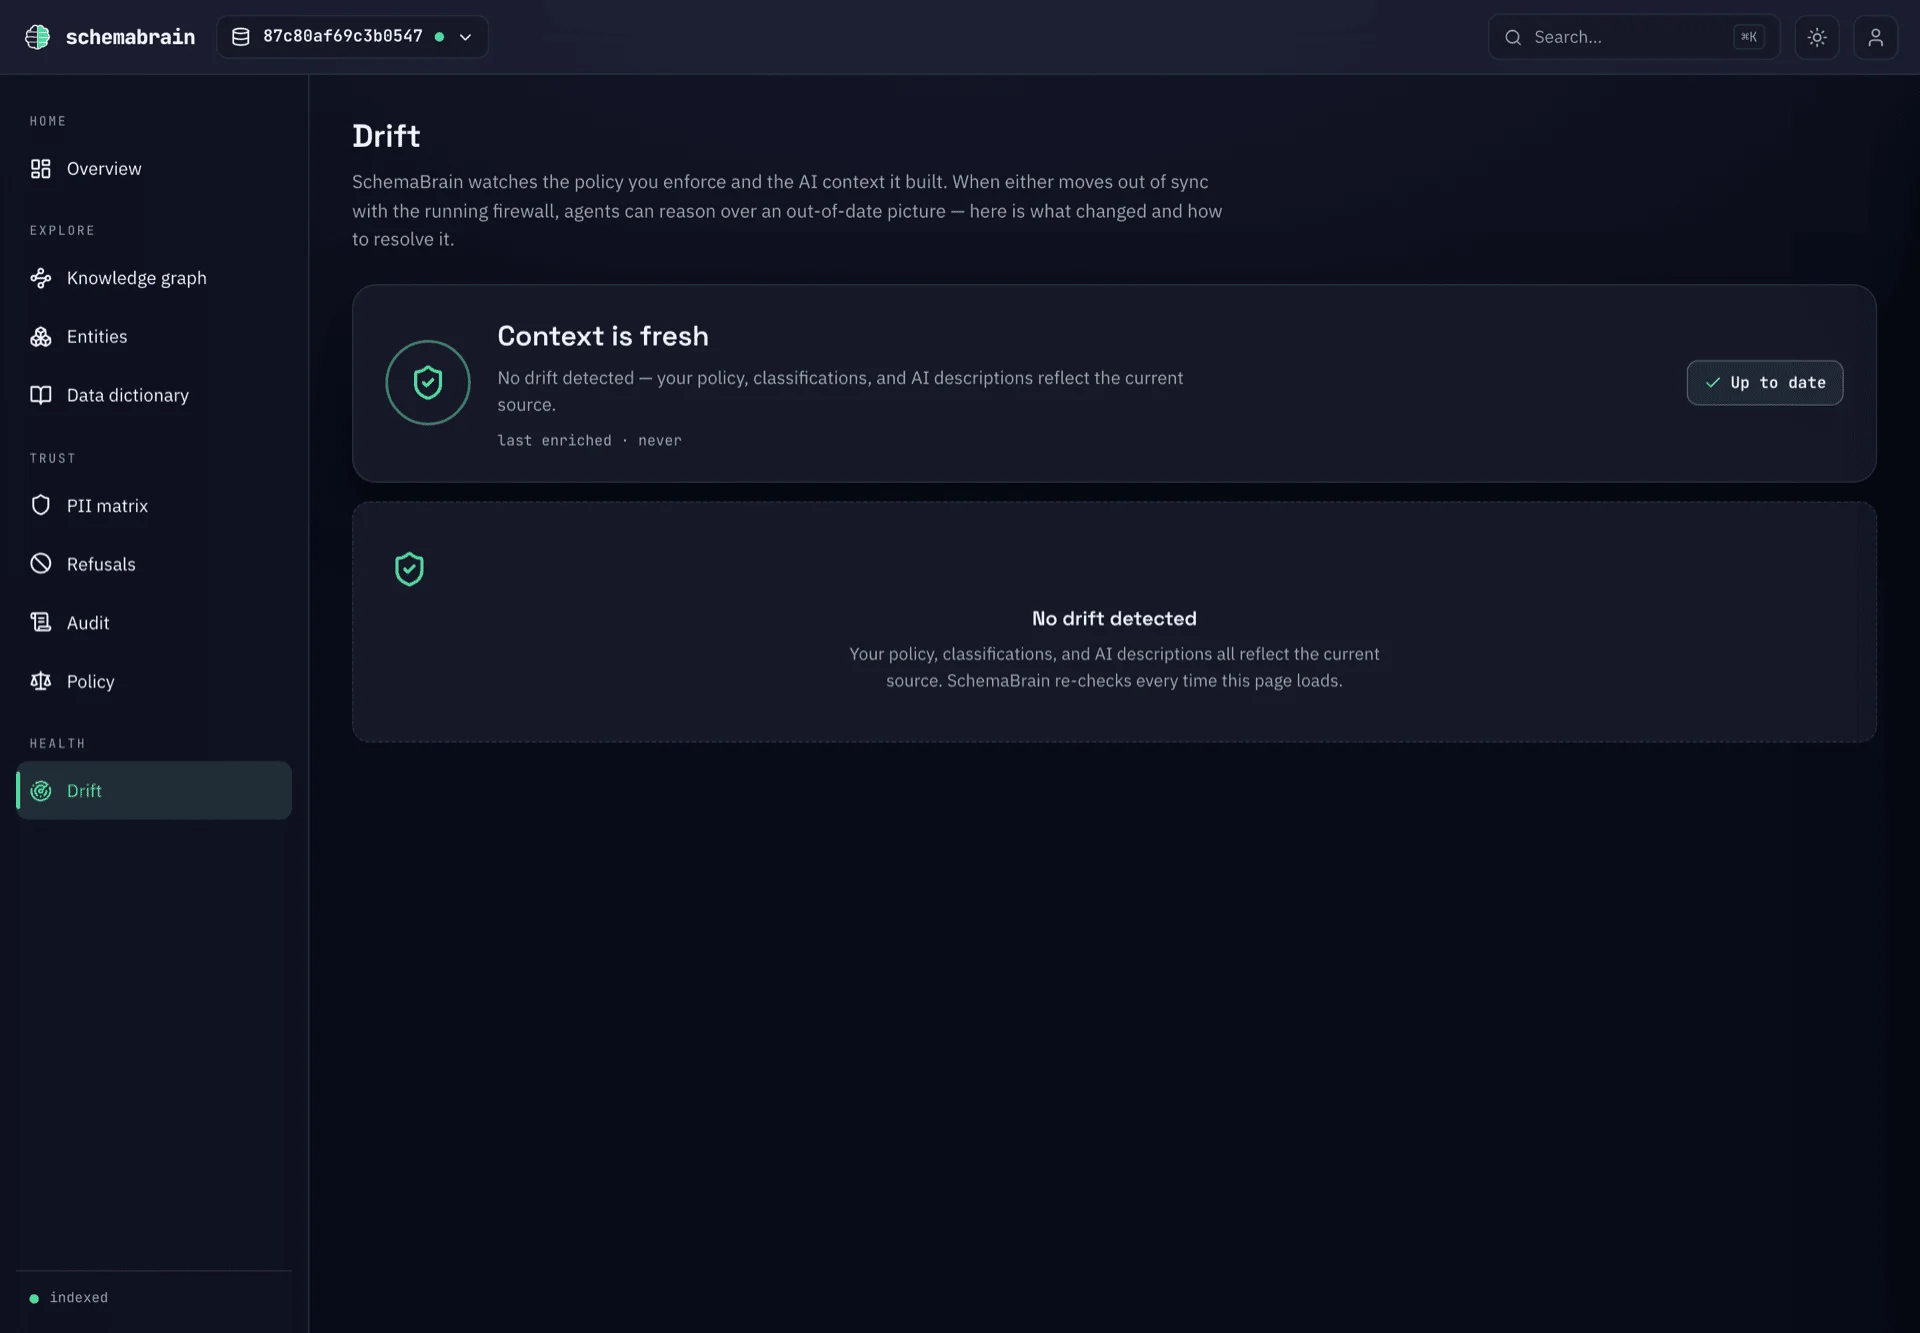 It is intentionally a viewer, not a console. No settings, no entity editor, no SQL pad. Configuration still lives in the CLI; YAML still lives on disk.
***
## Install
The dashboard ships as an opt-in extra so the base install stays slim and free of web-server dependencies (`fastapi`, `uvicorn`, `sse-starlette`).
```bash pip theme={null}
pip install 'schemabrain[ui]'
```
```bash uv theme={null}
uv pip install 'schemabrain[ui]'
```
The pre-built Next.js static export is bundled inside the wheel at `schemabrain/dashboard/static/`. **End users never need Node, npm, or pnpm.** Contributor-dev runs are different — see the repo's `web/README.md`.
A base `pip install schemabrain` will not boot the dashboard. Running `schemabrain dashboard` without the `[ui]` extra exits with `schemabrain dashboard requires the [ui] extra. Install with 'pip install schemabrain[ui]'.` and a non-zero exit code.
***
## Launch
Index your database first (or run `schemabrain init`), then point the dashboard at the same store:
```bash theme={null}
schemabrain dashboard --store-path ./schemabrain.db
```
You should see:
```
schemabrain dashboard: serving at http://127.0.0.1:7878/
press Ctrl+C to stop
```
The default browser opens automatically. Pass `--no-open` in CI or on headless machines to skip the auto-open.
### Flags
| Flag | Default | Purpose |
| ------------------- | ------------------ | ----------------------------------------------------------------------------------------------------------------- |
| `--store-path PATH` | `./schemabrain.db` | SQLite store written by `schemabrain index`. The sidecar auto-resolves the canonical `source_id` from this store. |
| `--port N` | `7878` | TCP port to bind on `127.0.0.1`. Must be in the user-port range (1024-65535). |
| `--no-open` | (off — auto-opens) | Skip launching the default browser. Use in CI / headless environments. |
**There is no `--host` flag — by design.** The bind host is a constant in `schemabrain/dashboard/sidecar.py` (`BIND_HOST = "127.0.0.1"`). The dashboard is local-only, full stop. Use SSH port-forwarding if you need to view a remote instance.
***
## What the sidecar exposes
The FastAPI app declares **only `GET` routes**. There is no `POST`, `PUT`, `PATCH`, or `DELETE` handler anywhere in the surface — a CI invariant test asserts this against the live route table.
| Route | Purpose |
| ---------------------------------- | ------------------------------------------------------------------------------------------------------------------------------------------------------------- |
| `GET /` | Serves the bundled Next.js static export (the UI itself). |
| `GET /api/health` | Liveness + a `SELECT 1` probe against the SQLite store. |
| `GET /api/meta` | Charter version, dashboard schema version, list of indexed sources. Credential-safe — connection URLs are hashed to a canonical short ID before being echoed. |
| `GET /api/entities/pii-matrix` | Per-entity PII category counts + totals for the PII matrix surface. |
| `GET /api/entities` | Flat entity list. |
| `GET /api/entities/{name}/columns` | Per-entity column drill-down (physical schema + metrics + canonical joins). |
| `GET /api/audit/rows` | Paginated rows from `mcp_audit`. |
| `GET /api/audit/rows/{id}` | One audit row with full body. |
| `GET /api/audit/verify` | Re-walks the chain hash; returns `intact` or `broken`. |
| `GET /api/audit/merkle/root` | Derived RFC-6962 Merkle root over every row (`tree_size`, `root_hex`). |
| `GET /api/audit/rows/{id}/proof` | O(log n) inclusion proof so the browser can reconcile a row to the root. |
| `GET /api/audit/refusals` | Filtered list of `status='refused'` rows. |
| `GET /api/audit/refusals/{id}` | One refusal row with envelope detail. |
| `GET /api/audit/stream` | Server-Sent Events stream for live row push (2s tick). |
Every JSON response carries two headers:
* `X-Schemabrain-Charter-Version: 1.2` — the MCP envelope contract.
* `X-Schemabrain-Dashboard-Schema: 1.5` — the dashboard JSON contract.
Consumers can detect protocol drift without parsing the body.
***
## How source resolution works
The `useSourceId()` hook on the client and the `_resolve_source()` helper on the server share one rule: **the dashboard never hardcodes a source ID**. Resolution order:
1. If the request includes `?source_connection_id=...`, use it.
2. Else, if `SidecarConfig.source_connection_id` was set at boot, use it.
3. Else, ask the store for `list_distinct_source_connection_ids()` and pick the first.
4. If the store knows about zero sources, return `null` and let the UI render an empty state.
This means a freshly-installed `schemabrain[ui]` against a previously-indexed store "just works" — no flag plumbing required.
***
## What the dashboard is *not*
* **It is not a write surface.** The sidecar declares no mutating verbs. The UI has no inputs that POST.
* **It is not a SQL console.** SchemaBrain does not execute arbitrary SQL anywhere — see [`/mechanism/read-only`](/mechanism/read-only). The dashboard inherits that posture.
* **It is not network-reachable.** The bind host is hardcoded to `127.0.0.1`. There is no flag, env var, or config file that changes this.
* **It is not authenticated.** Because it binds to localhost, the dashboard relies on OS-level user isolation. Don't run it on a shared multi-user machine without thinking through who owns `127.0.0.1`.
* **It is not a settings editor.** Curate entities, metrics, and joins via the [CLI](/reference/cli/overview). The dashboard reflects state; it does not edit it.
* **It does not include an entity browser.** Editable entity workflows are post-v0.4.
***
## Related
Which entities and columns carry catastrophic-leak categories.
Live feed of refused tool calls + the envelopes the agent received.
Tamper-evident audit chain, with one-click verify.
Flags and defaults for the launch command.
It is intentionally a viewer, not a console. No settings, no entity editor, no SQL pad. Configuration still lives in the CLI; YAML still lives on disk.
***
## Install
The dashboard ships as an opt-in extra so the base install stays slim and free of web-server dependencies (`fastapi`, `uvicorn`, `sse-starlette`).
```bash pip theme={null}
pip install 'schemabrain[ui]'
```
```bash uv theme={null}
uv pip install 'schemabrain[ui]'
```
The pre-built Next.js static export is bundled inside the wheel at `schemabrain/dashboard/static/`. **End users never need Node, npm, or pnpm.** Contributor-dev runs are different — see the repo's `web/README.md`.
A base `pip install schemabrain` will not boot the dashboard. Running `schemabrain dashboard` without the `[ui]` extra exits with `schemabrain dashboard requires the [ui] extra. Install with 'pip install schemabrain[ui]'.` and a non-zero exit code.
***
## Launch
Index your database first (or run `schemabrain init`), then point the dashboard at the same store:
```bash theme={null}
schemabrain dashboard --store-path ./schemabrain.db
```
You should see:
```
schemabrain dashboard: serving at http://127.0.0.1:7878/
press Ctrl+C to stop
```
The default browser opens automatically. Pass `--no-open` in CI or on headless machines to skip the auto-open.
### Flags
| Flag | Default | Purpose |
| ------------------- | ------------------ | ----------------------------------------------------------------------------------------------------------------- |
| `--store-path PATH` | `./schemabrain.db` | SQLite store written by `schemabrain index`. The sidecar auto-resolves the canonical `source_id` from this store. |
| `--port N` | `7878` | TCP port to bind on `127.0.0.1`. Must be in the user-port range (1024-65535). |
| `--no-open` | (off — auto-opens) | Skip launching the default browser. Use in CI / headless environments. |
**There is no `--host` flag — by design.** The bind host is a constant in `schemabrain/dashboard/sidecar.py` (`BIND_HOST = "127.0.0.1"`). The dashboard is local-only, full stop. Use SSH port-forwarding if you need to view a remote instance.
***
## What the sidecar exposes
The FastAPI app declares **only `GET` routes**. There is no `POST`, `PUT`, `PATCH`, or `DELETE` handler anywhere in the surface — a CI invariant test asserts this against the live route table.
| Route | Purpose |
| ---------------------------------- | ------------------------------------------------------------------------------------------------------------------------------------------------------------- |
| `GET /` | Serves the bundled Next.js static export (the UI itself). |
| `GET /api/health` | Liveness + a `SELECT 1` probe against the SQLite store. |
| `GET /api/meta` | Charter version, dashboard schema version, list of indexed sources. Credential-safe — connection URLs are hashed to a canonical short ID before being echoed. |
| `GET /api/entities/pii-matrix` | Per-entity PII category counts + totals for the PII matrix surface. |
| `GET /api/entities` | Flat entity list. |
| `GET /api/entities/{name}/columns` | Per-entity column drill-down (physical schema + metrics + canonical joins). |
| `GET /api/audit/rows` | Paginated rows from `mcp_audit`. |
| `GET /api/audit/rows/{id}` | One audit row with full body. |
| `GET /api/audit/verify` | Re-walks the chain hash; returns `intact` or `broken`. |
| `GET /api/audit/merkle/root` | Derived RFC-6962 Merkle root over every row (`tree_size`, `root_hex`). |
| `GET /api/audit/rows/{id}/proof` | O(log n) inclusion proof so the browser can reconcile a row to the root. |
| `GET /api/audit/refusals` | Filtered list of `status='refused'` rows. |
| `GET /api/audit/refusals/{id}` | One refusal row with envelope detail. |
| `GET /api/audit/stream` | Server-Sent Events stream for live row push (2s tick). |
Every JSON response carries two headers:
* `X-Schemabrain-Charter-Version: 1.2` — the MCP envelope contract.
* `X-Schemabrain-Dashboard-Schema: 1.5` — the dashboard JSON contract.
Consumers can detect protocol drift without parsing the body.
***
## How source resolution works
The `useSourceId()` hook on the client and the `_resolve_source()` helper on the server share one rule: **the dashboard never hardcodes a source ID**. Resolution order:
1. If the request includes `?source_connection_id=...`, use it.
2. Else, if `SidecarConfig.source_connection_id` was set at boot, use it.
3. Else, ask the store for `list_distinct_source_connection_ids()` and pick the first.
4. If the store knows about zero sources, return `null` and let the UI render an empty state.
This means a freshly-installed `schemabrain[ui]` against a previously-indexed store "just works" — no flag plumbing required.
***
## What the dashboard is *not*
* **It is not a write surface.** The sidecar declares no mutating verbs. The UI has no inputs that POST.
* **It is not a SQL console.** SchemaBrain does not execute arbitrary SQL anywhere — see [`/mechanism/read-only`](/mechanism/read-only). The dashboard inherits that posture.
* **It is not network-reachable.** The bind host is hardcoded to `127.0.0.1`. There is no flag, env var, or config file that changes this.
* **It is not authenticated.** Because it binds to localhost, the dashboard relies on OS-level user isolation. Don't run it on a shared multi-user machine without thinking through who owns `127.0.0.1`.
* **It is not a settings editor.** Curate entities, metrics, and joins via the [CLI](/reference/cli/overview). The dashboard reflects state; it does not edit it.
* **It does not include an entity browser.** Editable entity workflows are post-v0.4.
***
## Related
Which entities and columns carry catastrophic-leak categories.
Live feed of refused tool calls + the envelopes the agent received.
Tamper-evident audit chain, with one-click verify.
Flags and defaults for the launch command.